[Book Review] A Plague Upon Our House by Scott Atlas

A Plague Upon Our House: My Fight at the Trump White House to Stop COVID from Destroying America

Scott W. Atlas, M.D.

Post Hill Press, New York, 2021

A Plague Upon Our House is Scott Atlas’s personal account of his four months (“end of July” 2020 — December 1, 2020) as a special adviser to the White House on the COVID-19 pandemic and pandemic response. It also discusses some of his interactions with and advice to Florida state governor Ron De Santis. The book paints an alarming picture of key medical advisers Tony Fauci, Deborah Birx, and Robert Redfield as incompetent, highly political, dishonest career bureaucrats in the worst sense of the words and President Trump as a disengaged, indecisive, publicity obsessed leader quite far from his abrasive, tough, “You’re fired!” public image. Although Dr. Atlas avoids using names in several cases, a number of President’s Trump staff come across as young, inexperienced, perhaps well-meaning but clearly out of their depth.

Dr. Atlas and his colleagues had some success influencing the actual policies in Florida, although according to the book Governor DeSantis seems to have largely made up his own mind from reading the direct scientific literature and studying the actual data, using experts like Dr. Atlas, Harvard epidemiologist Martin Kulldorf, Oxford epidemiologist Sunetra Gupta, and his Stanford colleague Jay Battacharya as a sounding board to check his understanding. Although Dr. Atlas describes a few successes at the federal level, he had no real success at the national, federal level or with most states and state governors. While he is highly critical of the medical advisers Fauci/Birx/Redfield and even President Trump who hired him, he performs little analysis of his own failings — a trait most of us share.

Missing References and Data

The book does not have end notes or footnotes with primary references, despite Dr. Atlas’s background as an academic scholar and the highly technical nature of the issues. He presumably has a list of key references that he used as policy adviser to the White House that could have easily been incorporated into the book. He makes the point repeatedly during the book that he spent every day reviewing the latest research papers and COVID data, whereas the Fauci/Birx/Redfield “troika” seemingly did not.

The lack of primary references (or any references at all) is a serious drawback because Google and other online searches, even with the less censored DuckDuckGo search engine, often turn up hysterical mainstream news articles and “Fact Checks” rather than the primary references. Readers who have followed the technical literature and non-mainstream arguments closely will not find anything new technically in the book, but others who rely on the mainstream media likely will find contradicting claims and “information” using a search engine, even DuckDuckGo.

Dr. Atlas’s Wikipedia page (Jan 26, 2022), for example, is highly negative:

Wikipedia entry for Scott Atlas (Jan. 26, 2022)

The ineffectiveness of masks is the only technical issue out of many in the book where Atlas presents actual data in plots on pages 287-294 showing no effect from mask mandates on daily news cases in many different countries and US states (yes, theoretically mask mandates could fail although masks work and Atlas does not address this counter-argument). He does not provide primary references even for these plots.

There was and is a substantial scientific literature showing masks, especially the cloth masks, are largely or completely ineffective or even harmful. Atlas provides no references to this literature. Given the remarkable contradiction on masks and other topics between most mainstream sources such as Wikipedia and highly visible statements on cable and broadcast “news” shows by ostensible experts such as Dr. Fauci and Atlas’s claims in the book, Atlas clearly should provide primary references for incredulous readers.

Although there is much discussion of masks in the book including assertions that SARS-COV-2 is airborne, that is it floats in the air like tiny smoke or dust particles and does not drop to surfaces under gravity as larger droplets of saliva would, Dr. Atlas fails to provide references or adequately describe this key technical issue.

In particular, observers have suspected that plagues, especially respiratory illnesses, were airborne since ancient times. Mask wearing has frequently failed during historical epidemics such as the 1918 influenza epidemic. “Public health” authorities have either ignored the historical failure or rationalized it away.

In the 1950’s and 1960’s a team of researchers led by Richard Riley at Johns Hopkins University conducted an extensive series of experiments at a VA hospital showing that tuberculosis, a bacteria which is much larger and heavier than the influenza virus or the coronaviruses, is airborne. They did this by connecting tuberculosis (TB) wards at the hospital to rooms with guinea pigs via air ducts, otherwise isolating the guinea pigs from possible sources of infection, and placing ultraviolet (UV) sterilizing lights in one duct to one room of guinea pigs. The guinea pigs in the room with the UV lights in the connecting duct did not contract TB whereas the guinea pigs in the other room with no sterilizing UV light in the connecting duct did contract TB.

Although it is now “generally accepted” that TB is airborne, “public health” authorities have continued to claim all other respiratory illnesses are transmitted by large saliva droplets that fall to the ground and other surfaces quickly under gravity. This claim was used to justify the “social distancing,” mask wearing, lockdowns, and other policies that have clearly failed to contain COVID and yet continue.

Magically, perhaps as citizens began to realize that heavy droplet transmission would imply rapid efficient spread through groceries at giant stores such as Safeway, Walmart, and Target that were allowed stay open while smaller competitors serving small local regions were closed, the US CDC flipped and claimed “fomites,” meaning those saliva droplets landing on grocery products, store shelves, etc. did not spread the disease — “just kidding.” More precisely they began to claim the surface transmission was so minor that cleaning with various chemicals was no longer recommended.

Remarkably, the “public health” authorities appear to have never replicated the Johns Hopkins TB study or performed similar studies for influenza or coronaviruses despite multi-billion dollar CDC and NIH budgets and continual publicly stated concern about repeats of the 1918 “flu” pandemic.

The practical consequences of airborne transmission are profound. Masks are not expected to work as the tiny viral particles, about 1/500th the width of a human hair, will flow with the air through even microscopic holes in masks, and with the air around the masks. Confining large numbers of people to apartment complexes with interior hallways or shared ventilation is likely to rapidly spread any respiratory disease. People confined in the same house are all likely to be exposed to the virus. Herding everyone into a few small enclosed giant “Big Box” stores such as Walmart or Safeway is likely to provide an efficient route for rapid spread of the disease. Social distancing is likely to be mostly ineffective especially indoors as the viral particles diffuse through any enclosed space.

Curiously, A Plague Upon Our House, despite correctly pointing out the failure of the masks, does not delve into the key issue of airborne transmission and its implications.

President Donald Trump (Official White House Photo)
President Donald Trump

Trump: Indecisive or Disingenuous?

Although most of Atlas’s criticism is directed at the seemingly incompetent “troika” of Anthony Fauci, Deborah Birx, and Robert Redfield, he is also highly critical of Trump who in fact supported the policies promoted by the troika, despite occasional tweets seemingly to the contrary. Atlas describes Trump as friendly to him and always agreeing with Atlas in private conversations. Atlas is mystified by Trump’s failure to act on his stated beliefs as shared with Atlas, blaming this both on the troika and various Trump advisers rather than Trump personally. Atlas either failed to consider Trump might be pretending to agree with him or chose not to discuss that possibility in his book.

President Trump is a highly successful businessman at one point deeply involved in the rough and tumble casino industry — even taking over Resorts International, a notorious company with a scandalous past. He has a long history of close personal and business “relationships” with murky, rather iffy characters such as the late attorney Roy Cohn, the late singer Michael Jackson, and the late “hedge fund billionaire” without an actual hedge fund Jeffrey Epstein amongst others. That Trump might be something less than straightforward with Atlas or others does not seem improbable.

The actual voting base of Trump is not Pfizer or Bill Gates/Moderna or other giant companies like Walmart or Safeway, it is small business owners, farmers, and large numbers of working class Americans, many employed by small businesses. Atlas briefly notes that Trump’s FDA commissioner Scott Gottlieb took a lucrative position as a member of the board of directors of Pfizer. Atlas does say he disagreed with Gottlieb strongly, but claims he did not attribute Gottlieb’s positions to a conflict of interest with Pfizer. Preteritio?

President Trump had expressed some vaccine skepticism during the 2016 campaign, even suggesting that vaccines might play a causal role in the dramatic increase in autism in the United States over the last three decades. He apparently did reach out to Democrat vaccine skeptic Robert F. Kennedy Jr to pursue a detailed audit of the seemingly confidential public health databases used by CDC and other agencies to clarify the situation.

Robert F. Kennedy Jr. attributes the sudden reversal on this project during the transition period to a large contribution to the Trump inauguration fund by Pfizer. According to Federal Election Commission (FEC) filings, Pfizer donated $1 million dollars to the 58th Presidential Inaugural Committee on December 22, 2016 (see page 163 of the linked 510 page FEC document).

Pfizer has a long history of criminal activities, including an international conspiracy in the 1990s with Archer Daniels Midland and several other companies to fix the price of citric acid (a key ingredient of Coca-Cola amongst other products), lysine, and possibly other food additives.

The lockdown policies have been disastrous for these more ordinary Americans while enriching Amazon and other Big Tech companies, giant retailers such as Walmart and Safeway, and indirectly the vaccine makers like Pfizer. Unrest and opposition to the policies surfaced quickly among President Trump’s base, many of whom, contrary to the Democrat picture of mesmerized cultists, are wary of the flamboyantly sleazy casino magnate turned champion of the common man.

It is not uncommon for politicians to pay lip service to the opinions and policies preferred by their voters while in fact enacting the policies preferred by their campaign contributors and business partners.

Lack of Criticism of Operation Warp Speed

A major weakness of the book is Dr. Atlas’s unreserved enthusiasm and endorsement of Operation Warp Speed and the experimental mRNA based vaccines. Although he does not devote much space to this, it is crystal clear in reading the book. He writes approvingly about the policy to exempt the vaccine makers such as Pfizer and Moderna from liability should the vaccines prove harmful.

Dr. Atlas expresses no concern that vaccines based on the SARS-COV-2 spike protein which bonds to the ACE-2 (angiotensin converting enzyme) receptor and appears to severely disrupt the cardiovascular system, causing the often lethal blood clots reported in some COVID patients, might produce similar cardiovascular problems in vaccinated persons, although he does oppose vaccine mandates and the unscientific ignoring of natural immunity in statements by the “public health” authorities, the troika until recently, and others.

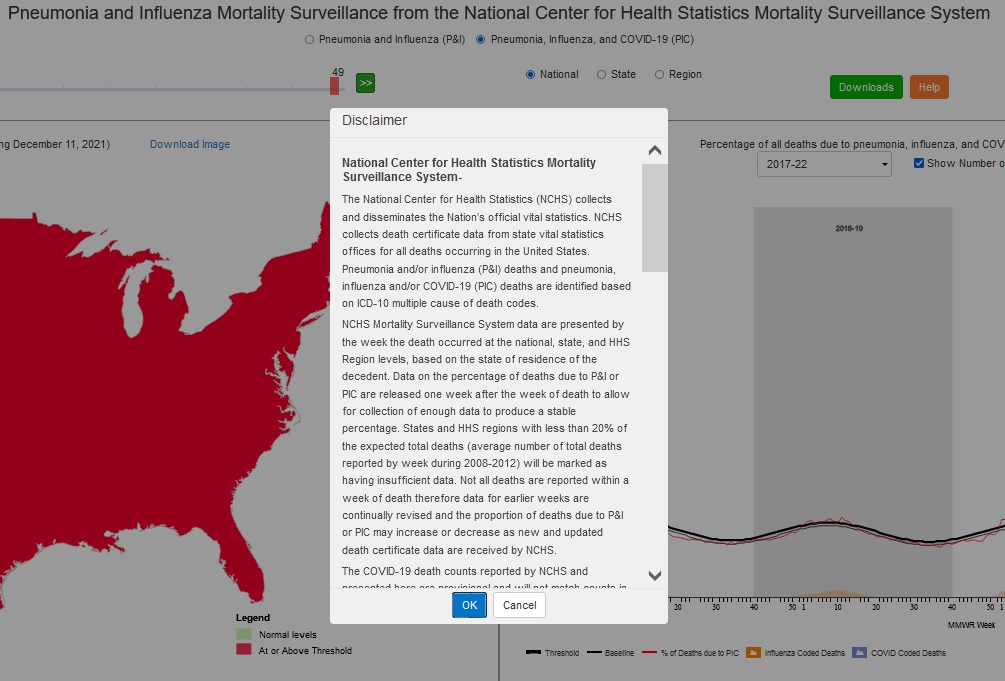
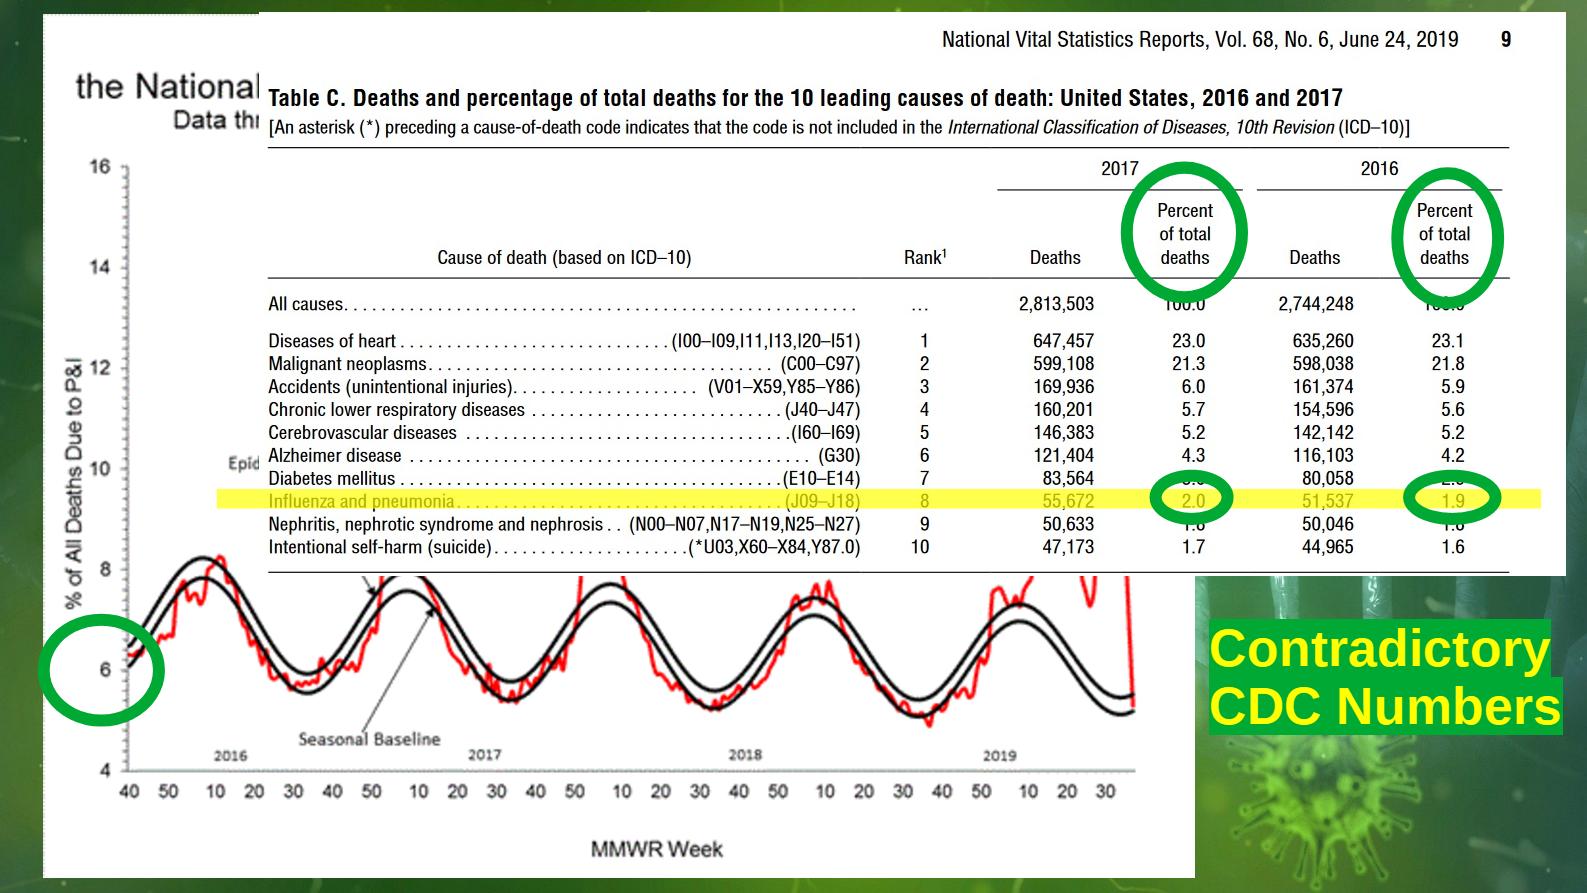
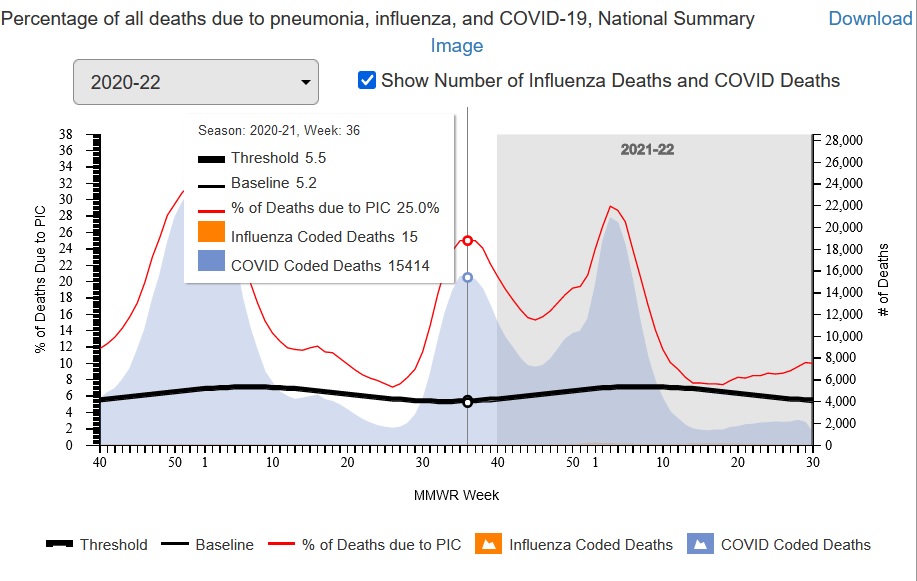
According to the book, Dr. Atlas wrote or completed writing the book in August 2021, arguably just before or as the delta wave was starting to smash through the vaccines, hospitalizing and killing large numbers of Americans if you believe the CDC’s Fluview web site and underlying data as reported.

Vaccine Failure: The COVID-19 “Delta” Wave in August 2021 (about Week 36 of 2021) (US CDC FluView Web Site)

Dr. Atlas expresses no concern about the short circuiting of numerous safety precautions that usually take years to approve a vaccine. Operation Warp Speed met its hyper-aggressive schedule as Atlas proudly claims only by disregarding established safety measures which he does not mention.

In some contexts, usually when making excuses for obvious failures or huge cost and schedule overruns which are common in R&D, scientists such as Dr. Atlas often claim an 80 to 90 percent failure rate for scientific research. For every Manhattan Project that succeeded there are dozens of tokamak fusion power programs, wars on cancer, and so on that have failed. Yet, Dr. Atlas expresses no concerns or fallback plans for the likely failure of Operation Warp Speed if the 80 to 90 percent failure rate is true.

Lack of Self Criticism

Although Dr. Atlas is highly critical of the troika and even President Trump, he does not take himself to task even though he clearly failed to achieve the policies he recommended, citing only a few small successes. This is something of relevance to all of us who seek better policies and to end the irrational hysteria about the COVID pandemic.

Dr. Atlas does claim he was naive about the political process and how politicized the COVID response was. He also is appalled by the censorship, propaganda, and extensive lying or at least false statements by the mainstream media, both “legacy” operations such as the New York Times and social media giants such as YouTube (owned by Google/Alphabet). Other than being outraged, he makes little effort in the book to analyze how and why this is happening and how to successfully combat it.

One may wonder about these claims of naivete given that Dr. Atlas is a fellow at the controversial, mostly conservative Hoover Institution at Stanford University where he has been a health policy analyst for years. The Hoover Institution as a whole is no stranger to bitter partisan political battles.

In any case, Dr. Atlas makes no attempt to understand the crazed “no lie is too big,” “no number of COVID deaths is too many” to GET TRUMP AT ANY COST mentality of the mass media and many others. Indeed this behavior is puzzling and alarming, leading naturally both to psychological explanations such as the “mass formation” theory proposed by Professor Mattias Desmet and grand “conspiracy theories” of varying degrees of seeming plausibility such as those about Klaus Schwab, the World Economic Forum, and the “Great Reset.”

The Collective Fight or Flight Response

Certainly, whether by design (conspiracy) or accident or a mixture of both, we are experiencing a collective fight or flight response on a nearly global scale, a natural response in ancient times when your tribe is attacked by another tribe, in which masks and vaccination are shibboleths to identify friend and foe, like the phrase “lollapalooza” reputedly used by American soldiers in the Pacific during World War II to separate native English speaking US soldiers from Japanese soldiers especially at night.

The collective fight or flight response is the same response that caused massacres of alleged witches, vagabonds, Jews, and others accused of poisoning wells during the Black Death. The fight or flight response is instinctual, overriding higher cognitive functions. High intelligence and formal education does not prevent it or increase one’s ability to shut it off when it is unwarranted — an overreaction for example. It is hard coded into all or nearly all human beings: rich and poor, ignorant and highly educated, dumb and super-smart.

Social conformity, hostility to dissent, censorship, and propaganda all increase markedly during historical episodes of the collective fight or flight response such as during both World Wars. Because of the demonic imagery associated with the Nazis and the Holocaust, it is easier to see the irrationality of the response in World War I than World War II. It is however an irrational, instinctual response rooted in a direct physical attack by a rival tribe in ancient times, not adapted to even modern wars let alone pandemics.

Trump as the American Hitler

Regardless of the motives of any elite conspiracy, Donald Trump’s surprise victory in 2016 caused a collective fight or flight response based on a deep seated belief in and fear of an “American Hitler,” among many Americans, disproportionately liberal Democrats, an insane, evil demagogue who would capture the votes of hillbillies and other stigmatized mostly poor rural whites and lead the US and the World to destruction.

This frightening archetype is common in US popular culture and serious scholarship, dating back at least to the fears of and historical reactions to William Jennings Bryan and most importantly the crusade against Louisiana Senator Huey Long culminating in Long’s assassination in September of 1935, painting Long as the US equivalent of Hitler.

If you believe Trump is the American Hitler, a secular liberal progressive equivalent of the Antichrist figure of the Book of Revelations, then anything is justified to stop him: lying, cheating, stealing, even advocating policies that will in fact increase deaths during a pandemic to undermine him, particularly given the spectre of global thermonuclear war even though the “American Hitler,” Trump, shows a marked antipathy to global thermonuclear war.

Completely irrational behavior such as trying to stop efforts to make deals with Russia and North Korea becomes justifiable if Trump is the American Hitler. Even loopy ideas like provoking a conflict with nuclear armed super-power Russia over Ukraine (currently in the news) to rally the public and prevent Trump or a Trump successor from returning in the mid-term elections may seem reasonable to otherwise intelligent people. Keep in mind if the Trump Republicans were to gain a super-majority in both houses in the 2022 election, they could in principle invalidate the contested 2020 election and restore Trump in 2022 instead of 2024.

Regardless of how unjustified and perhaps unhinged such beliefs about Trump, potential Trump replacements such as Governor De Santis or Senator Rand Paul, or Trump voters actually are, Dr. Atlas, Trump himself, and others have failed to allay them. Once a group of people or a single person is in the instinctual fight or flight response, reason usually fails until they calm down. It is incumbent upon Dr. Atlas to assess why he failed and how to succeed. This is a major weakness of the book.

Conclusion

A Plague Upon Our House paints an alarming portrait of the US government, President Trump and especially the “troika” of Anthony Fauci, Deborah Birx, and Robert Redfield and their many allies — something of continuing concern given Fauci’s current role in the Biden administration. It is filled with anecdotes suggesting Fauci is either incompetent or something worse.

The book would be stronger and more helpful in the continuing crisis if Dr. Atlas carefully evaluated the reasons for his failure to stop the disastrous policies, inability to reach the public and allay the concerns of frightened “never Trumpers,” and how to succeed now in the continuing crisis.

(C) 2022 by John F. McGowan, Ph.D.

About Me

John F. McGowan, Ph.D. solves problems using mathematics and mathematical software, including developing gesture recognition for touch devices, video compression and speech recognition technologies. He has extensive experience developing software in C, C++, MATLAB, Python, Visual Basic and many other programming languages. He has been a Visiting Scholar at HP Labs developing computer vision algorithms and software for mobile devices. He has worked as a contractor at NASA Ames Research Center involved in the research and development of image and video processing algorithms and technology. He has published articles on the origin and evolution of life, the exploration of Mars (anticipating the discovery of methane on Mars), and cheap access to space. He has a Ph.D. in physics from the University of Illinois at Urbana-Champaign and a B.S. in physics from the California Institute of Technology (Caltech).

[Article] The US CDC’s Broad Legal Disclaimer for the Fluview Interactive COVID Death Numbers

This is the legal disclaimer that appears when starting the US Centers for Disease Control (CDC’s) Fluview Interactive application which purports to report the percentage of deaths per week “due to” pneumonia and influenza (P&I) prior to March 2020 and pneumonia, influenza, and COVID-19 (PIC) since March 2020. (URL: http://gis.cdc.gov/grasp/fluview/mortality.html )

Emphasis is added to key phrases. The NOTES explain the definition and meaning of several technical terms used in the disclaimer.

The disclaimer essentially says, in plain English, the data — the COVID-19 death counts — which is presented with no estimates of statistical or systematic errors is provisional and could be entirely wrong. Two sentences in one paragraph appear to contradict one another.

The CDC had a budget of just over $12 billion in the Fiscal Year 2019. URL: https://www.cdc.gov/budget/documents/fy2019/fy-2019-detail-table.pdf

Disclaimer (Downloaded December 24, 2021)

National Center for Health Statistics Mortality Surveillance System-

NOTE: The National Center for Health Statistics (NCHS) is a division of the US Centers for Disease Control and Prevention (CDC).

The National Center for Health Statistics (NCHS) collects and disseminates the Nation’s official vital statistics. NCHS collects death certificate data from state vital statistics offices for all deaths occurring in the United States. Pneumonia and/or influenza (P&I) deaths and pneumonia, influenza and/or COVID-19 (PIC) deaths are identified based on ICD-10 multiple cause of death codes.

NOTE: ICD-10 is the International Classification of Diseases 10th Edition, a medical classification list by the World Health Organization (WHO). “ICD-10 multiple cause of death codes” refers to multiple “causes of death” listed on death certificates. Many death certificates have many causes of death such as emphysema, a degenerative eventually terminal condition, and pneumonia. One cause of the death is singled out as the “underlying cause of death” or UCOD. One cause of death is singled out as the “immediate cause of death.” The immediate cause of death is often not the underlying cause of death. For example, emphysema may be the underlying cause of death and pneumonia, the influenza virus, or the “common cold” may be the immediate cause of death.

NCHS Mortality Surveillance System data are presented by the week the death occurred at the national, state, and HHS Region levels, based on the state of residence of the decedent. Data on the percentage of deaths due to P&I or PIC are released one week after the week of death to allow for collection of enough data to produce a stable percentage. States and HHS regions with less than 20% of the expected total deaths (average number of total deaths reported by week during 2008-2012) will be marked as having insufficient data. Not all deaths are reported within a week of death therefore data for earlier weeks are continually revised and the proportion of deaths due to P&I or PIC may increase or decrease as new and updated death certificate data are received by NCHS.

NOTE: Notice the conflict between “to allow for collection of enough data to produce a stable percentage” and “the proportion of deaths due to P&I or PIC may increase or decrease as new and updated death certificate data are received by NCHS.”  Percentage is a way of expressing the proportion: for example, fifty percent (a percentage) versus one half (another way of expressing the same percentage).  “Stable” usually means not changing or fluctuating” (Merriam Webster) when used in this way.

The COVID-19 death counts reported by NCHS and presented here are provisional and will not match counts in other sources, such as media reports or numbers from county health departments. COVID-19 deaths may be classified or defined differently in various reporting and surveillance systems. Death counts reported by NCHS include deaths that have COVID-19 listed as a cause of death and may include laboratory confirmed COVID-19 deaths and clinically confirmed COVID-19 deaths. Provisional death counts reported by NCHS track approximately 1-2 weeks behind other published data sources on the number of COVID-19 deaths in the U.S. These reasons may partly account for differences between NCHS reported death counts and death counts reported in other sources.

NOTE:  The language “a cause of death” likely means that COVID-19 (or pneumonia or influenza in pre-2020 figures) is one of the causes of death listed on the death certificate, not necessarily the underlying cause of death (UCOD).  Remember, many death certificates have multiple causes of death, one of which is identified as the underlying cause of death. (UCOD).  Note also that the disclaimer specifically states that NCHS numbers “will not match..numbers from county health departments.” County health departments are presumably official, primary sources of death data with qualified staff — medical examiners and others.

In previous seasons, the NCHS surveillance data were used to calculate the percent of all deaths occurring each week that had pneumonia and/or influenza (P&I) listed as a cause of death. Because of the ongoing COVID-19 pandemic, COVID-19 coded deaths were added to P&I to create the PIC (pneumonia, influenza, and/or COVID-19) classification. PIC includes all deaths with pneumonia, influenza, and/or COVID-19 listed on the death certificate. Because many influenza deaths and many COVID-19 deaths have pneumonia included on the death certificate, P&I no longer measures the impact of influenza in the same way that it has in the past. This is because the proportion of pneumonia deaths associated with influenza is now influenced by COVID-19-related pneumonia. The PIC percentage and the number of influenza and number of COVID-19 deaths will be presented in order to help better understand the impact of these viruses on mortality and the relative contribution of each virus to PIC mortality.

The PIC percentages are compared to a seasonal baseline of P&I deaths that is calculated using a periodic regression model that incorporates a robust regression procedure applied to data from the previous five years. An increase of 1.645 standard deviations above the seasonal baseline of P&I deaths is considered the “epidemic threshold,” i.e., the point at which the observed proportion of deaths is significantly higher than would be expected at that time of the year in the absence of substantial influenza, and now COVID-related mortality. Baselines and thresholds are calculated at the national and regional level and by age groups.

For more information on pneumonia and influenza mortality surveillance please visit: http://www.cdc.gov/flu/weekly/overview.htm#Mortality

* The 10 U.S. Department of Health and Human Services regions include the following jurisdictions. Region 1: Connecticut, Main, Massachusetts, New Hampshire, Rhode Island, and Vermont; Region 2: New Jersey, New York, and New York City; Region 3: Delaware, District of Columbia, Maryland, Pennsylvania, Virginia, and West Virginia; Region 4: Alabama, Florida, Georgia, Kentucky, Mississippi, North Carolina, South Carolina, and Tennessee; Region 5: Illinois, Indiana, Michigan, Minnesota, Ohio, and Wisconsin; Region 6: Arkansas, Louisiana, New Mexico, Oklahoma, and Texas; Region 7: Iowa, Kansas, Missouri, and Nebraska; Region 8: Colorado, Montana, North Dakota, South Dakota, Utah, and Wyoming; Region 9: Arizona, California, Hawaii, and Nevada; Region 10: Alaska, Idaho, Oregon, and Washington.

(C) 2021 by John F. McGowan, Ph.D.

About Me

John F. McGowan, Ph.D. solves problems using mathematics and mathematical software, including developing gesture recognition for touch devices, video compression and speech recognition technologies. He has extensive experience developing software in C, C++, MATLAB, Python, Visual Basic and many other programming languages. He has been a Visiting Scholar at HP Labs developing computer vision algorithms and software for mobile devices. He has worked as a contractor at NASA Ames Research Center involved in the research and development of image and video processing algorithms and technology. He has published articles on the origin and evolution of life, the exploration of Mars (anticipating the discovery of methane on Mars), and cheap access to space. He has a Ph.D. in physics from the University of Illinois at Urbana-Champaign and a B.S. in physics from the California Institute of Technology (Caltech).

[Article] Known Problems with US CDC’s Pneumonia, Influenza, and COVID-19 (PIC) Death Numbers

Introduction

This is a summary (below) of our lengthy (about 13,000 word) paper on the many issues with the CDC’s pneumonia, influenza, and COVID-19 (PIC) death numbers. It is about 1,000 words in length (5-10 minute read) and summarizes most of our key findings.

John F. McGowan, Ph.D., Tam Hunt, Josh Mitteldorf, PhD. Improving CDC Data Practices Recommendations for Improving the United States Centers for Disease Control (CDC) Data Practices for Pneumonia, Influenza, and COVID-19 (v 1.1). Authorea. November 29, 2021. DOI:10.22541/au.163822197.79126460/v1
(https://doi.org/10.22541/au.163822197.79126460/v1)

URL:
https://www.authorea.com/users/425106/articles/547336-improving-cdc-data-practices-recommendations-for-improving-the-united-states-centers-for-disease-control-cdc-data-practices-for-pneumonia-influenza-and-covid-19-v-1-1

Key Points/Summary

A number of CDC data presentation and statistical practices since the start of the COVID-19 pandemic in early 2020 have not followed common scientific and engineering practice. Several problems with data presentation and analyses for pneumonia and influenza death numbers – which have been merged with COVID-19 death numbers in the FluView web site ‒ predate the pandemic.

Before the pandemic (March 2020), the non-standard data presentation and statistical practices appear to increase the number of deaths attributed to the influenza virus and imply the death counts are certain whereas substantial uncertainty exists due to uncertainty in the assignment of the cause of death and other reasons. Since the pandemic, these practices appear to do the same for SARS-COV-2 and COVID-19.

Remarkably, the CDC had at least three (3) different numbers for deaths attributed to pneumonia and influenza before 2020: the leading causes of death report count with about two (2) percent of deaths (about 55,000) per year attributed to influenza and pneumonia, the influenza virus deaths model with about 55,000 deaths per year attributed specifically to the influenza virus, and the FluView web site count with about 6-8 percent of deaths (about 188,000) per year attributed to pneumonia and influenza.

The FluView number differs from the other two death numbers by a factor of OVER THREE. The probable reason for this difference is that — according to the FluView technical notes — FluView counts deaths where pneumonia or influenza is listed as “a cause of death” whereas the leading cause of death report — according to the technical notes — counts only deaths where pneumonia or influenza is listed as “the underlying cause of death.” This probably reflects a large uncertainty in the assignment of the cause of death in respiratory illness cases; indeed the underlying cause of death may be ill-defined in many cases.

The CDC’s excess deaths estimates on their excess deaths web site does not report any standard goodness of fit statistics, notably the coefficient of determination often known as “R squared” and the “chi squared” goodness of fit statistic. Our analysis shows that different models with the same goodness of fit statistics give different estimates of the number of excess deaths, varying by up to 200,000 deaths in 2020. The CDC web site does not report this systematic modeling error.

The CDC appears to have chosen a set of parameters for the Noufaily/Farrington algorithm used to estimate excess deaths by the CDC that gives a lower “R Squared” value for goodness of fit than other choices and a HIGHER ESTIMATE of excess deaths — whereas common scientific and engineering practice would be to use the models with the best goodness of fit statistics, the “R Squared” closest to 1.0.

The Noufailly/Farrington algorithm is an empirical trend detection and extrapolation model theoretically incapable of accurately modeling the aging “baby boom” population which would be expected to produce “excess deaths” in recent years — nor is it able to explain the puzzling near stop of the increase in deaths per year reported in the immediate pre-pandemic years 2017-2019 despite the aging population.

The CDC does not publish (as of Dec 2021) years of life lost (YLL) estimates which include increases in suicides, homicides, and other adverse effects of the lockdowns, nor systematic modeling errors on the YLL estimates. YLL can illustrate the difference between a disease that largely kills those nearing death anyway versus a disease that easily kills the healthy.

The CDC issued a COVID death certificate guidance document in April of 2020 that appears to change the standards for assigning the underlying cause of death (UCOD) from the pre-pandemic practice for assigning the underlying cause of death for pneumonia and influenza, making COVID-19 the underlying cause of death in the many cases where the person who died had serious pre-existing conditions such as chronic bronchitis, emphysema, heart failure etc.. — the deaths counted in FluView but not in the leading causes of death report. There does not appear to have been any public comment on this guidance document to date.

In general the CDC does not report statistical errors, systematic errors, or estimates of biases in pneumonia, influenza, and COVID-19 death numbers. They do not report any monitoring of the effect of their guidance documents or other directives on the assignment of the cause of death by doctors, medical examiners, and others.

These issues are sometimes shared with other government agencies such as the US Social Security Administration (SSA) and US Census Bureau that work closely with the CDC.

Death counts for both individual causes and “all cause” deaths are frequently reported as precise to the last digit without any statistical or systematic errors, despite both known and unknown uncertainties in counting deaths, such as missing persons, unreported deaths due to deceased payee fraud, the ~1,000 living Americans incorrectly added to the government Deaths Master File (DMF), each month, for unknown reasons, and considerable uncertainties in assigning the underlying cause of death (UCOD) by coroners and doctors.

Similarly, raw counts, adjusted counts, and estimates – often based on incompletely documented computer mathematical models – are often not clearly identified as such. The Deaths Master File, with names and dates of death of deceased persons is exempt from the Freedom of Information Act (FOIA) and unavailable to the general public, independent researchers, and even other government agencies such as the IRS. This confidentiality of data makes independent verification of many CDC numbers, such as the excess deaths numbers tracked during the COVID-19 pandemic, all but impossible.

This omission of common scientific and engineering practices raises questions about the accuracy of the CDC’s data, conclusions, and public health policies in a number of important areas, including the COVID-19 pandemic.

The non-standard data presentation and statistical practices appear to increase the number of deaths attributed to the influenza virus and imply the death counts are certain whereas substantial uncertainty exists due to uncertainty in the assignment of the cause of death and other causes. Since the pandemic, these practices appear to do the same for SARS-COV-2 and COVID-19.

END OF SUMMARY

(C) 2021 by John F. McGowan, Ph.D.

About Me

John F. McGowan, Ph.D. solves problems using mathematics and mathematical software, including developing gesture recognition for touch devices, video compression and speech recognition technologies. He has extensive experience developing software in C, C++, MATLAB, Python, Visual Basic and many other programming languages. He has been a Visiting Scholar at HP Labs developing computer vision algorithms and software for mobile devices. He has worked as a contractor at NASA Ames Research Center involved in the research and development of image and video processing algorithms and technology. He has published articles on the origin and evolution of life, the exploration of Mars (anticipating the discovery of methane on Mars), and cheap access to space. He has a Ph.D. in physics from the University of Illinois at Urbana-Champaign and a B.S. in physics from the California Institute of Technology (Caltech).

[Article] Fixing the CDC’s Problematic COVID Death Numbers

Posted an updated version of our paper on fixing the US Centers for Disease Control (CDC)’s problematic pneumonia, influenza, and COVID-19 (PIC) death numbers.

John F. McGowan, Ph.D., Tam Hunt, Josh Mitteldorf, PhD. Improving CDC Data Practices Recommendations for Improving the United States Centers for Disease Control (CDC) Data Practices for Pneumonia, Influenza, and COVID-19 (v 1.1). Authorea. November 29, 2021.
DOI: 10.22541/au.163822197.79126460/v1

Key points are:

o The CDC has at least three different estimates/counts of deaths from influenza and pneumonia before March 2020, two of which (FluView and the leading causes of death report) differ by a factor of over three.  FluView attributes about 6-8 percent of deaths to pneumonia and influenza each year and the leading causes of death report attributes about 2 percent of deaths each year to pneumonia and influenza.   The FluView numbers have been expanded to incorporate COVID deaths since March 2020.

o The likely cause of the discrepancy between the FluView and leading causes of death numbers is that the FluView numbers, based on the technical notes, count any death where pneumonia and/or influenza is listed as “a cause of death” whereas the leading causes of death report counts only deaths where pneumonia and/or influenza is listed as the “underlying cause of death.”   Except for the fine print in the technical notes, the language, labels and titles on graphs etc., on both FluView and the leading cause of death reports state the deaths are caused by (“due to”) pneumonia and influenza.

o What does this mean for COVID?  The CDC appears to have changed the criterion for assignment of underlying cause of death for COVID in their April 2020 COVID death certificate guidance to always assign COVID as the underlying cause of death even in cases of chronic lower respiratory disease and COPD (a subset of chronic lower respiratory disease usually meaning chronic bronchitis or emphysema).  Hence the CDC’s deaths “from COVID” are probably comparable to the larger FluView deaths — about 188,000 deaths per year before March 2020 — or an even larger number due to the attribution of deaths to COVID that would be called heart attack or stroke deaths absent a positive COVID test or diagnosis.  This supports but does not prove the hypothesis that COVID is largely a threat to a subset of vulnerable persons with preexisting serious health problems such as COPD and largely or entirely not a threat to the general healthy population; we do not state this in the paper but it is an obvious implication.

o Extensive failures to follow common scientific and engineering practice and use of confusing terminology.  Lack of statistical and systematic errors, especially with respect to the assignment of  a/the cause of death which many studies show is substantially uncertain — as appears illustrated by the discrepancy between the leading causes of death report and the FluView numbers.  Frequent confusion between what is a model/estimate and what is a count. 

(C) 2021 by John F. McGowan, Ph.D.

About Me

John F. McGowan, Ph.D. solves problems using mathematics and mathematical software, including developing gesture recognition for touch devices, video compression and speech recognition technologies. He has extensive experience developing software in C, C++, MATLAB, Python, Visual Basic and many other programming languages. He has been a Visiting Scholar at HP Labs developing computer vision algorithms and software for mobile devices. He has worked as a contractor at NASA Ames Research Center involved in the research and development of image and video processing algorithms and technology. He has published articles on the origin and evolution of life, the exploration of Mars (anticipating the discovery of methane on Mars), and cheap access to space. He has a Ph.D. in physics from the University of Illinois at Urbana-Champaign and a B.S. in physics from the California Institute of Technology (Caltech).

[Video] CDC Provincetown COVID-19 Outbreak Data Does NOT Show Vaccines Working

https://odysee.com/@MathematicalSoftware:5/cdc-provincetown-covid-19-outbreak-data-does-not-show-vaccines-work:3

Alternative Video: NewTube Brighteon BitChute ARCHIVE

The Provincetown, Massachusetts (Cape Cod, Barnstable County) COVID-19 outbreak does NOT prove that the COVID-19 vaccines are working as widely claimed in the mainstream media. (See the CDC Report “Outbreak of SARS-CoV-2 Infections, Including COVID-19 Vaccine Breakthrough Infections, Associated with Large Public Gatherings — Barnstable County, Massachusetts,” https://www.cdc.gov/mmwr/volumes/70/wr/pdfs/mm7031e2-H.pdf)

Article: http://wordpress.jmcgowan.com/wp/article-us-cdc-provincetown-covid-19-outbreak-data-does-not-show-vaccines-work/

About Us:

Main Web Site: https://mathematical-software.com/
Censored Search: https://censored-search.com/
A search engine for censored Internet content. Find the answers to your problems censored by advertisers and other powerful interests!

Subscribe to our free Weekly Newsletter for articles and videos on practical mathematics, Internet Censorship, ways to fight back against censorship, and other topics by sending an email to: subscribe [at] mathematical-software.com

Avoid Internet Censorship by Subscribing to Our RSS News Feed: http://wordpress.jmcgowan.com/wp/feed/

Legal Disclaimers: http://wordpress.jmcgowan.com/wp/legal/

Support Us:
PATREON: https://www.patreon.com/mathsoft
SubscribeStar: https://www.subscribestar.com/mathsoft

BitChute (Video): https://www.bitchute.com/channel/HGgoa2H3WDac/
Brighteon (Video): https://www.brighteon.com/channels/mathsoft
Odysee (Video): https://odysee.com/@MathematicalSoftware:5
NewTube (Video): https://newtube.app/user/mathsoft
Minds (Video): https://www.minds.com/math_methods/
Locals (Video): https://mathematicalsoftware.locals.com/
Archive (Video): https://archive.org/details/@mathsoft

(C) 2021 by John F. McGowan, Ph.D.

About Me

John F. McGowan, Ph.D. solves problems using mathematics and mathematical software, including developing gesture recognition for touch devices, video compression and speech recognition technologies. He has extensive experience developing software in C, C++, MATLAB, Python, Visual Basic and many other programming languages. He has been a Visiting Scholar at HP Labs developing computer vision algorithms and software for mobile devices. He has worked as a contractor at NASA Ames Research Center involved in the research and development of image and video processing algorithms and technology. He has published articles on the origin and evolution of life, the exploration of Mars (anticipating the discovery of methane on Mars), and cheap access to space. He has a Ph.D. in physics from the University of Illinois at Urbana-Champaign and a B.S. in physics from the California Institute of Technology (Caltech).

[Article] US CDC Provincetown COVID-19 Outbreak Data Does NOT Show Vaccines Work

The Provincetown, Massachusetts (Cape Cod, Barnstable County) COVID-19 outbreak does NOT prove that the COVID-19 vaccines are working as widely claimed in the mainstream media. (See the CDC Report “Outbreak of SARS-CoV-2 Infections, Including COVID-19 Vaccine Breakthrough Infections, Associated with Large Public Gatherings — Barnstable County, Massachusetts,” https://www.cdc.gov/mmwr/volumes/70/wr/pdfs/mm7031e2-H.pdf)

Media reports have often claimed that because no deaths were reported during the outbreak this proves the COVID-19 vaccines work. These media reports often make a comparison to deaths in January of 2021 when widespread vaccination began without actually citing or discussing estimates of the infection fatality rate (IFR) of COVID-19, let alone discussing the seasonality of the infection fatality rate of respiratory diseases.

Note that the infection fatality rate (IFR) of a disease is different from the case fatality rate (CFR) often reported in the mass media, sometimes as several percent for COVID-19 cases. The Case Fatality Rate is generally much larger than the infection fatality rate for many diseases and for COVID-19. Even medical experts who should know better mistakenly conflate CFR and IFR. IFR includes unreported and asymptomatic “cases” whereas CFR does not, hence the lower rate.

Both CFR and IFR can be difficult to compute, estimate, and compare because of varying definitions of “cases” and properly identifying the number of unreported cases with actual symptoms and asymptomatic infections. The COVID-19 pandemic has involved rapidly changing case definitions and poorly validated tests (PCR, antigen, antibody, and even other experimental tests).

Because the CDC was able to identify asymptomatic cases during the Provincetown outbreak, the IFR should be used to evaluate the published data, although the CDC may have missed some, possibly many asymptomatic cases.

Overall, 274 (79%) vaccinated patients with breakthrough infection were symptomatic.

CDC Report, Outbreak of SARS-CoV-2 Infections, Including COVID-19 Vaccine Breakthrough Infections, Associated with Large Public Gatherings — Barnstable County, Massachusetts, July 2021, Page 1

Similar claims that the outbreak proves the vaccines work have been made regarding the COVID-19 outbreak in heavily vaccinated Israel, so far involving a large fraction of vaccinated persons — often reported as 95% of the COVID-19 cases in Israel.

The CDC Provincetown, Massachusetts (Barnstable County, Cape Cod) data is analyzed in detail below.

According to the CDC report, 469 Massachusetts residents were identified with COVID-19 attributed to attending public events in “a town in Barnstable County, Massachusetts.” This is Provincetown on Cape Cod (Barnstable County, MA is Cape Cod). Of these, 346 (about 74 %) had been fully vaccinated with COVID-19 vaccines: both shots of the Moderna vaccine, both shots of the Pfizer vaccine, and the one shot J&J vaccine at least 14 days prior to infection with COVID-19. One-hundred and twenty-three (about 26 %) were unvaccinated. According to the CDC report, 69% of Massachusetts residents are fully vaccinated against COVID-19. Four fully vaccinated persons were hospitalized and only one unvaccinated person was hospitalized.

The ratio of vaccinated to unvaccinated infected persons (74%) is statistically indistinguishable from the 69% of vaccinated persons in Massachusetts. The most straightforward interpretation of this ratio is that the vaccine failed completely. If the vaccine substantially reduced the risk of infection, we would expect all or most of the cases to be in unvaccinated persons.

It is possible to explain away the ratio of infections by arguing that the vaccinated persons were overconfident, believing the media hype implying the vaccines confer full immunity (“safe and effective” repeated without qualification by most of the mass media). Hence they may have taken risks that spread the disease despite the vaccine, offsetting the benefits of the vaccine. It is clearly remarkable that this exactly offset the effect of the vaccines to produce the same ratio as the fraction of unvaccinated in the general Massachusetts population (the 69%).

The ratio of hospitalized vaccinated to unvaccinated persons (80%) is also statistically indistinguishable from the 69% of vaccinated persons in Massachusetts. The implied hospitalization rate of the vaccinated is 1.16% The implied hospitalization rate of the unvaccinated is only 0.81%. The hospitalization rates are statistically equivalent. Hospitalization is an imperfect proxy for severity of the disease. Consequently, the reported data do NOT show that the vaccines reduced the severity of the COVID-19 disease, contrary to claims by the US CDC, mainstream media, and others.

It is harder to explain away the hospitalizations, a proxy for serious COVID-19. The data gives statistically the same hospitalization rate for vaccinated and unvaccinated persons once infected. Again, however, one could argue the unvaccinated are healthier than the vaccinated to explain the absence of a preponderance of hospitalizations in the unvaccinated. In other words, very healthy persons are correctly less worried about handling a COVID-19 infection without the vaccine and refrain from taking the experimental, largely untested vaccine at this time.

The infection fatality rate (IFR) of COVID-19 (see — for example — https://www.who.int/bulletin/volumes/99/1/20-265892.pdf, https://pubmed.ncbi.nlm.nih.gov/33289900/) is generally estimated as only a few tenths of a percent for “young” (under 70) healthy persons — most of this in persons over 40. The Provincetown COVID-19 outbreak involved July 4th holiday party-goers, generally a young, healthy group. Using an IFR of 0.3%, we might naively expect about 1.2 deaths on average with an uncertainty of 1 death. Hence the absence of even one death in the Provincetown data is hardly surprising and does NOT show that the vaccines are working — even without considering the seasonality of respiratory diseases.

The incidence and mortality of respiratory diseases is seasonal with more infections, cases, hospitalizations, and death in January than in July. The reasons for this pattern are not understood, although it is often attributed to spread of the diseases among school-children in the United States. The sinusoidal — pendulum-like — variation shows no sign of a step up when school opens in the fall or a step down when schools close in the spring/early summer. The pattern suggests the variation is directly or indirectly driven by the Sun.

A number of causes for the seasonality of respiratory diseases have been suggested including vitamin D — which is involved in the immune system — production by sunlight, destruction of the respiratory disease causing organisms by sunlight and specifically the UV light in sunlight, unexplained benefits of sunlight other than vitamin D production, less energy diverted to staying warm when the Sun is stronger, and lower absolute humidity during the cold winter in many regions (NOT ALL) causing longer persistence in the atmosphere of aerosol particles with viruses and sometimes bacteria. In 2020, the COVID outbreak was highly seasonal in most nations with the exception of a surge in the summer in parts of the United States, possibly associated with the George Floyd/Black Lives Matter mass protests.

In conclusion, the CDC’s Provincetown COVID-19 outbreak data does NOT show the vaccines are working — to reduce infections, reduce severity of the disease, or prevent death. The statistics for serious cases of COVID-19 in both the unvaccinated and vaccinated persons are quite small — only five persons (four fully vaccinated, one unvaccinated) hospitalized and no deaths. The lack of deaths is not surprising given the low infection fatality rate (IFR) of COVID-19. Much larger statistics are needed to properly estimate any benefits or harms from the vaccines.

(C) 2021 by John F. McGowan, Ph.D.

About Me

John F. McGowan, Ph.D. solves problems using mathematics and mathematical software, including developing gesture recognition for touch devices, video compression and speech recognition technologies. He has extensive experience developing software in C, C++, MATLAB, Python, Visual Basic and many other programming languages. He has been a Visiting Scholar at HP Labs developing computer vision algorithms and software for mobile devices. He has worked as a contractor at NASA Ames Research Center involved in the research and development of image and video processing algorithms and technology. He has published articles on the origin and evolution of life, the exploration of Mars (anticipating the discovery of methane on Mars), and cheap access to space. He has a Ph.D. in physics from the University of Illinois at Urbana-Champaign and a B.S. in physics from the California Institute of Technology (Caltech).

[Video] COVID Vaccine Failure in CDC Barnstable, Massachusetts Data

COVID Vaccine Failure in CDC Barnstable, Massachusetts Data Video on Odysee

Alternative Video: NewTube ARCHIVE

The July 30, 2021 CDC report on an outbreak of COVID-19 (delta variant) in Barnstable County, Massachusetts (July 6-25, 2021) used to justify guidance for vaccinated persons to wear masks indoors appears to indicate the COVID vaccines failed to reduce either the rate of infection with COVID in the vaccinated or the hospitalization rate if infected, contrary to widespread statements in the mass media by public health authorities and others. Although there are some possible if improbable explanations, no explanation for this seeming contradiction appears to be present in the report.

Outbreak of SARS-CoV-2 Infections, Including COVID-19 Vaccine Breakthrough Infections, Associated with Large Public Gatherings — Barnstable County, Massachusetts, July 2021
Brown et al
Morbidity and Mortality Weekly Report
Early Release / Vol. 70 July 30, 2021
U.S. Department of Health and Human Services
Centers for Disease Control and Prevention
https://www.cdc.gov/mmwr/volumes/70/wr/pdfs/mm7031e2-H.pdf

Relevant Numbers from Report:

cases of COVID-19 associated with multiple summer events and large public gatherings in a town in Barnstable County, Massachusetts (July 6-25, 2021) 469
vaccination coverage among eligible Massachusetts residents 69.00%
cases in fully vaccinated 346 73.77%
cases in unvaccinated, which may include partially vaccinated and recently vaccinated (less than 14 days since final shot) 123 26.23%
number of vaccinated hospitalized 4
number of unvaccinated hospitalized 1
hospitalization rate of vaccinated infected with COVID-19 1.16%
hospitalization rate of unvaccinated infected with COVID-19 0.81%
Number of cases sequenced 133
Number of cases with B.1.617.2 (Delta) variant 120 90.23%
Number of symptomatic vaccinated cases 274
Number of symptomatic unvaccinated cases ?

About Us:

Main Web Site: https://mathematical-software.com/
Censored Search: https://censored-search.com/
A search engine for censored Internet content. Find the answers to your problems censored by advertisers and other powerful interests!

Subscribe to our free Weekly Newsletter for articles and videos on practical mathematics, Internet Censorship, ways to fight back against censorship, and other topics by sending an email to: subscribe [at] mathematical-software.com

Avoid Internet Censorship by Subscribing to Our RSS News Feed: http://wordpress.jmcgowan.com/wp/feed/

Legal Disclaimers: http://wordpress.jmcgowan.com/wp/legal/

Support Us:
PATREON: https://www.patreon.com/mathsoft
SubscribeStar: https://www.subscribestar.com/mathsoft

BitChute (Video): https://www.bitchute.com/channel/HGgoa2H3WDac/
Brighteon (Video): https://www.brighteon.com/channels/mathsoft
Odysee (Video): https://odysee.com/@MathematicalSoftware:5
NewTube (Video): https://newtube.app/user/mathsoft
Minds (Video): https://www.minds.com/math_methods/
Locals (Video): https://mathematicalsoftware.locals.com/
Archive (Video): https://archive.org/details/@mathsoft

#

(C) 2021 by John F. McGowan, Ph.D.

About Me

John F. McGowan, Ph.D. solves problems using mathematics and mathematical software, including developing gesture recognition for touch devices, video compression and speech recognition technologies. He has extensive experience developing software in C, C++, MATLAB, Python, Visual Basic and many other programming languages. He has been a Visiting Scholar at HP Labs developing computer vision algorithms and software for mobile devices. He has worked as a contractor at NASA Ames Research Center involved in the research and development of image and video processing algorithms and technology. He has published articles on the origin and evolution of life, the exploration of Mars (anticipating the discovery of methane on Mars), and cheap access to space. He has a Ph.D. in physics from the University of Illinois at Urbana-Champaign and a B.S. in physics from the California Institute of Technology (Caltech).

[Article] Improving CDC Data Practices: Recommendations for Improving the United States Centers for Disease Control (CDC) Data Practices for Pneumonia, Influenza, and COVID-19

This is a preprint of a new academic paper written by Tam Hunt, Josh Mitteldorf, Ph.D. and myself on the US Centers for Disease Control (CDC)’s data practices during the COVID-19 pandemic and for pneumonia and influenza prior to the pandemic. I am the corresponding author.

Abstract

During the pandemic, millions of Americans have become acquainted with the CDC because its reports and the data it collects affect their day-today lives. But the methodology used and even some of the data collected by CDC remain opaque to the public and to the community of academic epidemiology. In this paper, we highlight areas in which CDC methodology might be improved and where greater transparency might lead to broad collaboration. (1) “Excess” deaths are routinely reported, but not “years of life lost”, an easily-computed datum that is important for public policy. (2) What counts as an “excess death”? The method for computing the number of excess deaths does not include error bars and we show a substantial range of estimates is possible. (3) Pneumonia and influenza death data on different CDC pages is grossly contradictory. (4) The methodology for computing influenza deaths is not described in sufficient detail that an outside analyst might pursue the source of the discrepancy. (5) Guidelines for filling out death certificates have changed during the COVID-19 pandemic, preventing the comparison of 2020-21 death profiles with any previous year. We conclude with a series of explicit recommendations for greater consistency and transparency, and ultimately to make CDC data more useful to outside epidemiologists.

John F. McGowan, Ph.D., Tam Hunt, Josh Mitteldorf. Improving CDC Data Practices Recommendations for Improving the United States Centers for Disease Control (CDC) Data Practices for Pneumonia, Influenza, and COVID-19. Authorea. July 19, 2021.
DOI: 10.22541/au.162671168.86830026/v1

Here are the key recommendations from the paper:

Recommendations

In light of the previous discussion, we make a number of recommendations to improve CDC’s data practices, including improved observance of common scientific and engineering practice – such as use of significant figures and reporting of statistical and systematic errors. Common scientific and engineering practice is designed to prevent serious errors and should be followed rigorously in a crisis such as the COVID-19 pandemic.

Note that some of these recommendations may require changes in federal or state laws, federal or state regulations, or renegotiation of contracts between the federal government and states. This is probably the case for making the Deaths Master File (DMF), with names and dates of death of persons reported as deceased to the states and federal government, freely available to the public and other government agencies.

  • All CDC numbers, where possible, should be clearly identified as estimates, adjusted counts, or raw counts, with statistical errors and systematic errors given, using consistent clear standard language in all documents. The errors should be provided as both ninety-five percent (95%) confidence level intervals and the standard deviation – at least for the statistical errors.
  • In the case of adjusted counts, the raw count should be explicitly listed immediately following the adjusted count as well as a brief description of the adjustment and a reference for the adjustment methodology. For example, if the adjusted number of deaths in the United States in 2020 is 3.4 million but the raw count of deaths was 3.3 million with 100,000 deaths added to adjust for unreported deaths of undocumented immigrants, the web pages and reports would say:

Total deaths (2020): 3.4 million (adjusted, raw count 3.3 million, unreported deaths of undocumented immigrants, adjustment methodology citation: Smith et al, MMWR Volume X, Number Y)

  • The distinction between the leading causes of death report “pneumonia and influenza” deaths, ~55,000 per year pre-pandemic, and the FluView website “pneumonia and influenza” deaths, ~188,000 per year pre-pandemic, should be clarified in the labels and legends for the graphics and prominently in the table of leading causes of death or immediately adjacent text. Statistical and systematic errors on these numbers should be provided in graphs and tables.
  • In general, where grossly different raw counts, adjusted counts, or estimates are presented in CDC documents and websites with the same name, semantically equivalent or nearly equivalent names such as “pneumonia and influenza” and “influenza and pneumonia,” clearly distinct names should be used instead, or the reasons for the gross difference in the values should be prominently listed in the graphs and tables or immediately adjacent text. It should be easy for the public, busy health professionals, policy makers and others to recognize and understand the differences.
  • CDC should provide results for different models for the same data with similar R2 values – coefficient of determination – to give the audience a quick sense of the systematic modeling errors – since there is no generally accepted methodology for estimating the 95% confidence level for the systematic modeling errors. See Figure 7 above for an example.
  • All mathematical models should be free and open source with associated data provided using commonly used free open-source scientific programming languages such as Python or R, made available on the CDC website, GitHub, and other popular sources. The models and data should be provided in a package form such that anyone with access to a standard MS Windows, Mac OS X, or Linux/Unix computer can easily download and run the analysis – similar to the package structure used by the GNU project, for example.
  • Specifically, the influenza virus deaths model should be provided to the public as code and data. The justification for the increase in the number of deaths attributed to influenza (~6,000 to ~55,000) should be presented in clear language with supporting numbers, such as the false positive and negative rates for the laboratory influenza deaths and general diagnosis of influenza in the absence of a positive lab test as well as in the code and data.
  • With respect to excess deaths tracking, include all major select causes of death, rather than just the thirteen (13) in the cause-specific excess deaths that CDC tracks, which currently account for about 2/3 of all deaths.
  • Include a Years of Lives Lost (YLL) display for COVID-19 deathsi and non-COVID-19 deaths, as well as excess deaths analysis, due to the higher granularity of YLL analysis when compared to excess deaths analysis. Explain the pros and cons of both analytical tools. Do the same for any future pandemics or health crises.
  • Adopt or develop a different algorithm or algorithms for tracking excess deaths which are mostly attributed to non-infectious causes such as heart attacks, cancer, and strokes. The Farrington/Noufaily algorithms were specifically developed as an early warning for often non-lethal infectious disease outbreaks such as salmonella. A medically-based model or models that incorporates population demographics such as the aging “baby boom” and evolving death rates broken down by age, sex, and possibly other factors where known is probably a better practice rather than simple empirical trend models such as the Noufaily algorithm.
  • Eliminate the zeroing procedure in calculating excess deaths, in which negative excess deaths in some categories are set to zero, rather than being added to the full excess deaths sum over all categories.
  • The anonymized data with causes of death as close to the actual data as possible, e.g. the actual death certificates, should be available on the CDC website in a simple accessible widely used format such as CSV (comma separated values) files. The code used to aggregate the data into summary data such as the FluView website data files should also be public.
  • The full Deaths Master File (DMF) including the actual names of the deceased persons and dates of death should be made available to the general public, independent researchers, and others. This is critical to independent verification of many numbers from the CDC, SSA, and US Census.
  • COVID-19-related deaths figures should be tracked based on year-specific age of death, rather than 10-year age ranges, as is currently the case.
  • CDC frequently changes the structure and layout of the CSV files/spreadsheets on their websites. The CDC should either (1) not do this or (2) provide easy conversion between different file formats with each new format so it is trivial for third parties to quickly adapt to the changes without writing additional code. CDC should provide a program or program in a free and open source language like R to convert between the formats.
  • The CDC and other agencies should be required to announce and solicit public comment for changes to case definitions, data collection rules, etc. for key public policy data such as the COVID-19 case definitions, death certification guidelines, and coding rules. Other government agencies have significantly more public participation than CDC, which is appropriate in a modern democracy.
  • Any practices and policies imposed in a public emergency, such as case definitions, definitions of measured quantities, data reporting practices, etc. imposed without public comment and review, should have an expiration date (e.g. sixty days) beyond which they must be subject to public review. Public comment, reviews, and cost/benefit analyses should happen during this emergency period.

Enacting these reforms should reduce the risk of serious errors, increase the quality and accuracy of CDC data and analyses, as well as any policies or CDC guidelines based on the data and analysis, and strengthen public confidence in the CDC and public health policies.

(C) 2021 by John F. McGowan, Ph.D.

About Me

John F. McGowan, Ph.D. solves problems using mathematics and mathematical software, including developing gesture recognition for touch devices, video compression and speech recognition technologies. He has extensive experience developing software in C, C++, MATLAB, Python, Visual Basic and many other programming languages. He has been a Visiting Scholar at HP Labs developing computer vision algorithms and software for mobile devices. He has worked as a contractor at NASA Ames Research Center involved in the research and development of image and video processing algorithms and technology. He has published articles on the origin and evolution of life, the exploration of Mars (anticipating the discovery of methane on Mars), and cheap access to space. He has a Ph.D. in physics from the University of Illinois at Urbana-Champaign and a B.S. in physics from the California Institute of Technology (Caltech).

[Video] How to Copy Data Tables into Working Python Code with EMACS Hotkey

https://odysee.com/@MathematicalSoftware:5/how_to_copy_data_tables_into_working_python_code_with_emacs_hotkey:5?

Alternative Video: BitChute NewTube ARCHIVE

Censored Video: YouTube

HOW TO COPY AND PASTE DATA TABLES INTO WORKING PYTHON CODE WITH EMACS

Video shows how to select, copy, and paste text data tables into working Python code with the Emacs text and code editor’s rectangle mode and an EMACS hotkey.

EMACS HOTKEY CODE SHOWN: http://wordpress.jmcgowan.com/wp/code-functions-to-convert-a-text-data-table-to-working-python-code-in-emacs/

The Emacs text and code editor has a built in rectangle mode for selecting, copying, pasting, and maniuplating rectangular regions in text since Emacs 24.

https://www.gnu.org/software/emacs/manual/html_node/emacs/Rectangles.html

About Us:

Main Web Site: https://mathematical-software.com/
Censored Search: https://censored-search.com/
A search engine for censored Internet content. Find the answers to your problems censored by advertisers and other powerful interests!

Subscribe to our free Weekly Newsletter for articles and videos on practical mathematics, Internet Censorship, ways to fight back against censorship, and other topics by sending an email to: subscribe [at] mathematical-software.com

Avoid Internet Censorship by Subscribing to Our RSS News Feed: http://wordpress.jmcgowan.com/wp/feed/

Legal Disclaimers: http://wordpress.jmcgowan.com/wp/legal/

Support Us:
PATREON: https://www.patreon.com/mathsoft
SubscribeStar: https://www.subscribestar.com/mathsoft

BitChute (Video): https://www.bitchute.com/channel/HGgoa2H3WDac/
Brighteon (Video): https://www.brighteon.com/channels/mathsoft
Odysee (Video): https://odysee.com/@MathematicalSoftware:5
NewTube (Video): https://newtube.app/user/mathsoft
Minds (Video): https://www.minds.com/math_methods/
Locals (Video): https://mathematicalsoftware.locals.com/
Archive (Video): https://archive.org/details/@mathsoft

(C) 2021 by John F. McGowan, Ph.D.

About Me

John F. McGowan, Ph.D. solves problems using mathematics and mathematical software, including developing gesture recognition for touch devices, video compression and speech recognition technologies. He has extensive experience developing software in C, C++, MATLAB, Python, Visual Basic and many other programming languages. He has been a Visiting Scholar at HP Labs developing computer vision algorithms and software for mobile devices. He has worked as a contractor at NASA Ames Research Center involved in the research and development of image and video processing algorithms and technology. He has published articles on the origin and evolution of life, the exploration of Mars (anticipating the discovery of methane on Mars), and cheap access to space. He has a Ph.D. in physics from the University of Illinois at Urbana-Champaign and a B.S. in physics from the California Institute of Technology (Caltech).

[Code] Functions to Convert a Text Data Table to Working Python Code in EMACS

This is EMACS code and text editor LISP code to convert a space delimited text table into working Python code in EMACS. By default, it binds the python-table function below to the CTRL-= key sequence in EMACS for easy use. Add this code to your dot emacs EMACS startup file (~/.emacs). Restart EMACS to load the new dot emacs startup file.

Select the text data table in EMACS using rectangle-mark-mode — bound to CTRL-SPACEBAR by default — and press CTRL-= to convert the selected text data table to a Python NumPy fast numerical array definition. The emacs LISP function python-table automates the steps shown in the previous post “[Video] How to Copy and Paste Data Tables into Working Python Code with EMACS.”

(defun python-table-rows (inputStr)
  "Convert space delimited text table to working Python fast NumPy array definition code"
  (interactive "e")
  (setq head "table_name = np.array([\n")
  ;; replace thousands separator comma (,) with Python separator underscore (_)
  (setq temp1 (replace-regexp-in-string "," "_" inputStr))
  ;; enclose each row in [ (row) ],
;;  (setq temp2 (replace-regexp-in-string "\\(.*\\)" "[\\1]," temp1))
  (setq temp2 (replace-regexp-in-string "\\([a-zA-Z0-9_ \\.]*\\)" "[\\1]," temp1))
  ;; remove any spurious [],
  (setq temp2b (replace-regexp-in-string "\\[\\]," "" temp2))
  ;; convert repeated space delimeters to (comma)(space)
  (setq temp3 (replace-regexp-in-string " +" ", " temp2b))
  ;;  add ] to close list of lists, close paren ) to convert to numpy array
  (setq tail "])")
  ;; build entire Python code block
  (setq temp4 (concat head temp3))
  (setq temp5 (concat temp4 tail))
  ) ;; end defun python-table

(defun python-table ()
  " convert selected region with space separated text table to python code "
  (interactive)
  (message "running python-table") ;; progress message
  ;; use buffer-substring-no-properties to strip fonts etc.
  ;; get text from selected region and put in tmp variable
  (setq tmp (buffer-substring-no-properties (mark) (point)))
  ;; convert to Python Code and put in table variable
  (setq table (python-table-rows tmp))
  (message table) ;; progress message
  (delete-region (mark) (point))  ;; remove the region contents
  (insert table)  ;; replace with python code table definition
  ) ;; end defun ptable()

(global-set-key (kbd "C-=") 'python-table) ;; bind python-table to hot key

Use CTRL-X CTRL-F ~/.emacs RETURN to read in, display, and edit your dot emacs file in the EMACS editor.

How to Use

Add this code to your dot emacs file. Modify as appropriate if you know what you are doing.

Restart emacs.

Use the EMACS rectangle-mark-mode command — usually bound to CTRL-X SPACEBAR in EMACS — to select a rectangular text table as in the text below. Use Edit Menu | Copy or ESC-W to copy the text data table in EMACS.

This is an example of selecting, copying, and pasting a text table
into Python source code using the Emacs code and text editor.

Python is a popular programming language. With add on packages
such as NumPy, SciPy, and Matplotlib, it is a leading tool
for data analysis, scientific and numerical programming.

Demo Text Table
0.5      276
2.5      328
6.5      134
12.0     139
17.0   1,807 random notes here
22.0   3,342
29.5   5,340 commentary here
39.5   3,316
49.5   2,106
59.5   1,360 doodling here
69.5     562
79.5     270
89.5     120

This data is so great.

Three ways to select a rectangular text region in Emacs:

ESC-x rectangle-mark-mode
CTRL-X SPACE
SHIFT-(mouse drag)

URL: http://www.mathematical-software.com/

Use CTRL-y to paste the selected text table into Python code. Select the table and use CTRL-= to convert to working Python source code — a NumPy fast array definition with the values from the text table. The Python add-on packages NumPy, SciPy and MatPlotLib provide extensive numerical and statistical analysis functions and plotting.

(C) 2021 by John F. McGowan, Ph.D.

About Me

John F. McGowan, Ph.D. solves problems using mathematics and mathematical software, including developing gesture recognition for touch devices, video compression and speech recognition technologies. He has extensive experience developing software in C, C++, MATLAB, Python, Visual Basic and many other programming languages. He has been a Visiting Scholar at HP Labs developing computer vision algorithms and software for mobile devices. He has worked as a contractor at NASA Ames Research Center involved in the research and development of image and video processing algorithms and technology. He has published articles on the origin and evolution of life, the exploration of Mars (anticipating the discovery of methane on Mars), and cheap access to space. He has a Ph.D. in physics from the University of Illinois at Urbana-Champaign and a B.S. in physics from the California Institute of Technology (Caltech).