"""
Short demo How to Display Grid Lines in MatPlotLib
(C) 2022 by Mathematical Software Inc.
http://www.mathematical-software.com/
"""
# Python Standard Library
import os
import sys
import time
# NumPy and MatPlotLib add on Python packages/modules
import numpy as np
import matplotlib.pyplot as plt
XRANGE = 5.0
CUBE_CONST = 1.5
ACCELERATION = 9.8
VELOCITY = -20.0
x = np.linspace(-XRANGE, XRANGE, 200)
y = CUBE_CONST*x**3 + 0.5*ACCELERATION*x**2 + VELOCITY*x
# simple MatPlotLib plot
f1 = plt.figure()
ax = plt.axes() # get plot axes
ax.set_facecolor('lightgray') # background color of plot
plt.plot(x, y, 'g-')
plt.title('Grid Lines in MatPlotLib DEMO')
plt.xlabel('X')
plt.ylabel(f'Y = {CUBE_CONST:.2f}*X3 + {0.5*ACCELERATION:.2f}*x**2' f' + {VELOCITY:.2f}*x)')
plt.grid(which='major', color='black')
plt.grid(which='minor', color='gray')
plt.minorticks_on() # need this to see the minor grid lines
plt.show(block=True)
f1.savefig('how_to_display_grid_lines_in_matplotlib.jpg',
dpi=300)
(C) 2022 by John F. McGowan, Ph.D.
About Me
John F. McGowan, Ph.D. solves problems using mathematics and mathematical software, including developing gesture recognition for touch devices, video compression and speech recognition technologies. He has extensive experience developing software in C, C++, MATLAB, Python, Visual Basic and many other programming languages. He has been a Visiting Scholar at HP Labs developing computer vision algorithms and software for mobile devices. He has worked as a contractor at NASA Ames Research Center involved in the research and development of image and video processing algorithms and technology. He has published articles on the origin and evolution of life, the exploration of Mars (anticipating the discovery of methane on Mars), and cheap access to space. He has a Ph.D. in physics from the University of Illinois at Urbana-Champaign and a B.S. in physics from the California Institute of Technology (Caltech).
import numpy as np
one = np.array([[1], [2]])
two = np.array([[3], [4]])
blatz = np.vstack((one, two))
print(blatz)
[[1]
[2]
[3]
[4]]
How to combine two column vectors into a single column vector in Python and NumPy using vstack
(C) 2022 by John F. McGowan, Ph.D.
About Me
John F. McGowan, Ph.D. solves problems using mathematics and mathematical software, including developing gesture recognition for touch devices, video compression and speech recognition technologies. He has extensive experience developing software in C, C++, MATLAB, Python, Visual Basic and many other programming languages. He has been a Visiting Scholar at HP Labs developing computer vision algorithms and software for mobile devices. He has worked as a contractor at NASA Ames Research Center involved in the research and development of image and video processing algorithms and technology. He has published articles on the origin and evolution of life, the exploration of Mars (anticipating the discovery of methane on Mars), and cheap access to space. He has a Ph.D. in physics from the University of Illinois at Urbana-Champaign and a B.S. in physics from the California Institute of Technology (Caltech).
This article shows Python programming language source code to perform a simple linear model analysis of time series data. Most real world data is not linear but a linear model provides a common baseline starting point for comparison of more advanced, generally non-linear models.
Simulated Nearly Linear Data with Linear Model
"""
Standalone linear model example code.

Generate simulated data and fit model to this simulated data.

LINEAR MODEL FORMULA:

OUTPUT = MULT_T*DATE_TIME + MULT_1*INPUT_1 + MULT_2*INPUT_2 + CONSTANT + NOISE

set MULT_T to 0.0 for simulated data.  Asterisk * means MULTIPLY
from grade school arithmetic.  Python and most programming languages
use * to indicate ordinary multiplication.

(C) 2022 by Mathematical Software Inc.

Point of Contact (POC): John F. McGowan, Ph.D.
E-Mail: ceo@mathematical-software.com

"""

# Python Standard Library
import os
import sys
import time
import datetime
import traceback
import inspect
import glob
# Python add on modules
import numpy as np  # NumPy
import pandas as pd  # Python Data Analysis Library
import matplotlib.pyplot as plt  # MATLAB style plotting
from sklearn.metrics import r2_score  # scikit-learn
import statsmodels.api as sm  # OLS etc.

# STATSMODELS
#
# statsmodels is a Python module that provides classes and functions for
# the estimation of many different statistical models, as well as for
# conducting statistical tests, and statistical data exploration. An
# extensive list of result statistics are available for each
# estimator. The results are tested against existing statistical
# packages to ensure that they are correct. The package is released
# under the open source Modified BSD (3-clause) license.
# The online documentation is hosted at statsmodels.org.
#
# statsmodels supports specifying models using R-style formulas and pandas DataFrames.


def debug_prefix(stack_index=0):
    """
    return <file_name>:<line_number> (<function_name>)

    REQUIRES: import inspect
    """
    the_stack = inspect.stack()
    lineno = the_stack[stack_index + 1].lineno
    filename = the_stack[stack_index + 1].filename
    function = the_stack[stack_index + 1].function
    return (str(filename) + ":"
            + str(lineno)
            + " (" + str(function) + ") ")  # debug_prefix()


def is_1d(array_np,
          b_trace=False):
    """
    check if array_np is 1-d array

    Such as array_np.shape:  (n,), (1,n), (n,1), (1,1,n) etc.

    RETURNS: True or False

    TESTING: Use DOS> python -c "from standalone_linear import *;test_is_1d()"
    to test this function.

    """
    if not isinstance(array_np, np.ndarray):
        raise TypeError(debug_prefix() + "argument is type "
                        + str(type(array_np))
                        + " Expected np.ndarray")

    if array_np.ndim == 1:
        # array_np.shape == (n,)
        return True
    elif array_np.ndim > 1:
        # (2,3,...)-d array
        # with only one axis with more than one element
        # such as array_np.shape == (n, 1) etc.
        #
        # NOTE: np.array.shape is a tuple (not a np.ndarray)
        # tuple does not have a shape
        #
        if b_trace:
            print("array_np.shape:", array_np.shape)
            print("type(array_np.shape:",
                  type(array_np.shape))

        temp = np.array(array_np.shape)  # convert tuple to np.array
        reference = np.ones(temp.shape, dtype=int)

        if b_trace:
            print("reference:", reference)

        mask = np.zeros(temp.shape, dtype=bool)
        for index, value in enumerate(temp):
            if value == 1:
                mask[index] = True

        if b_trace:
            print("mask:", mask)

        # number of axes with one element
        axes = temp[mask]
        if isinstance(axes, np.ndarray):
            n_ones = axes.size
        else:
            n_ones = axes

        if n_ones >= (array_np.ndim - 1):
            return True
        else:
            return False
    # END is_1d(array_np)


def test_is_1d():
    """
    test is_1d(array_np) function  works
    """

    assert is_1d(np.array([1, 2, 3]))
    assert is_1d(np.array([[10, 20, 33.3]]))
    assert is_1d(np.array([[1.0], [2.2], [3.34]]))
    assert is_1d(np.array([[[1.0], [2.2], [3.3]]]))

    assert not is_1d(np.array([[1.1, 2.2], [3.3, 4.4]]))

    print(debug_prefix(), "PASSED")
    # test_is_1d()


def is_time_column(column_np):
    """
    check if column_np is consistent with a time step sequence
    with uniform time steps. e.g. [0.0, 0.1, 0.2, 0.3,...]

    ARGUMENT: column_np -- np.ndarray with sequence

    RETURNS: True or False
    """
    if not isinstance(column_np, np.ndarray):
        raise TypeError(debug_prefix() + "argument is type "
                        + str(type(column_np))
                        + " Expected np.ndarray")

    if is_1d(column_np):
        # verify if time step sequence is nearly uniform
        # sequence of time steps such as (0.0, 0.1, 0.2, ...)
        #
        delta_t = np.zeros(column_np.size-1)
        for index, tval in enumerate(column_np.ravel()):
            if index > 0:
                previous_time = column_np[index-1]
                if tval > previous_time:
                    delta_t[index-1] = tval - previous_time
                else:
                    return False

        # now check that time steps are almost the same
        delta_t = np.median(delta_t)
        delta_range = np.max(delta_t) - np.min(delta_t)
        delta_pct = delta_range / delta_t

        print(debug_prefix(),
              "INFO: delta_pct is:", delta_pct, flush=True)

        if delta_pct > 1e-6:
            return False
        else:
            return True  # steps are almost the same
    else:
        raise ValueError(debug_prefix() + "argument has more"
                         + " than one (1) dimension.  Expected 1-d")
    # END is_time_column(array_np)


def validate_time_series(time_series):
    """
    validate a time series NumPy array

    Should be a 2-D NumPy array (np.ndarray) of float numbers

    REQUIRES: import numpy as np

    """
    if not isinstance(time_series, np.ndarray):
        raise TypeError(debug_prefix(stack_index=1)
                        + " time_series is type "
                        + str(type(time_series))
                        + " Expected np.ndarray")

    if not time_series.ndim == 2:
        raise TypeError(debug_prefix(stack_index=1)
                        + " time_series.ndim is "
                        + str(time_series.ndim)
                        + " Expected two (2).")

    for row in range(time_series.shape[0]):
        for col in range(time_series.shape[1]):
            value = time_series[row, col]
            if not isinstance(value, np.float64):
                raise TypeError(debug_prefix(stack_index=1)
                                + "time_series[" + str(row)
                                + ", " + str(col) + "] is type "
                                + str(type(value))
                                + " expected float.")

    # check if first column is a sequence of nearly uniform time steps
    #
    if not is_time_column(time_series[:, 0]):
        raise TypeError(debug_prefix(stack_index=1)
                        + "time_series[:, 0] is not a "
                        + "sequence of nearly uniform time steps.")

    return True  # validate_time_series(...)


def fit_linear_to_time_series(new_series):
    """
    Fit multivariate linear model to data.  A wrapper
    for ordinary least squares (OLS).  Include possibility
    of direct linear dependence of the output on the date/time.
    Mathematical formula:

    output = MULT_T*DATE_TIME + MULT_1*INPUT_1 + ... + CONSTANT

    ARGUMENTS: new_series -- np.ndarray with two dimensions
                             with multivariate time series.
                             Each column is a variable.  The
                             first column is the date/time
                             as a float value, usually a
                             fractional year.  Final column
                             is generally the suspected output
                             or dependent variable.

                             (time)(input_1)...(output)

    RETURNS: fitted_series -- np.ndarray with two dimensions
                              and two columns: (date/time) (output
                              of fitted model)

             results --
                 statsmodels.regression.linear_model.RegressionResults

    REQUIRES: import numpy as np
              import pandas as pd
              import statsmodels.api as sm  # OLS etc.

    (C) 2022 by Mathematical Software Inc.

    """
    validate_time_series(new_series)

    #
    # a data frame is a package for a set of numbers
    # that includes key information such as column names,
    # units etc.
    #
    input_data_df = pd.DataFrame(new_series[:, :-1])
    input_data_df = sm.add_constant(input_data_df)

    output_data_df = pd.DataFrame(new_series[:, -1])

    # statsmodels Ordinary Least Squares (OLS)
    model = sm.OLS(output_data_df, input_data_df)
    results = model.fit()  # fit linear model to the data
    print(results.summary())  # print summary of results
                              # with fit parameters, goodness
                              # of fit statistics etc.

    # compute fitted model values for comparison to data
    #
    fitted_values_df = results.predict(input_data_df)

    fitted_series = np.vstack((new_series[:, 0],
                               fitted_values_df.values)).transpose()

    assert fitted_series.shape[1] == 2, \
        str(fitted_series.shape[1]) + " columns, expected two(2)."

    validate_time_series(fitted_series)

    return fitted_series, results  # fit_linear_to_time_series(...)


def test_fit_linear_to_time_series():
    """
    simple test of fitting  a linear model to simple
    simulated data.

    ACTION: Displays plot comparing data to the linear model.

    REQUIRES: import numpy as np
              import matplotlib.pyplot as plt
              from sklearn.metrics impor r2_score (scikit-learn)

    NOTE: In mathematics a function f(x) is linear if:

    f(x + y) = f(x) + f(y)  # function of sum of two inputs
                            # is sum of function of each input value

    f(a*x) = a*f(x)         # function of constant multiplied by
                            # an input is the same constant
                            # multiplied by the function of the
                            # input value

    (C) 2022 by Mathematical Software Inc.
    """

    # simulate monthly data for years 2010 to 2021
    time_steps = np.linspace(2010.0, 2022.0, 120)
    #
    # set random number generator "seed"
    #
    np.random.seed(375123)  # make test reproducible
    # make random walks for the input values
    input_1 = np.cumsum(np.random.normal(size=time_steps.shape))
    input_2 = np.cumsum(np.random.normal(size=time_steps.shape))

    # often awe inspiring Greek letters (alpha, beta,...)
    mult_1 = 1.0  # coefficient or multiplier for input_1
    mult_2 = 2.0   # coefficient or multiplier for input_2
    constant = 3.0  # constant value  (sometimes "pedestal" or "offset")

    # simple linear model
    output = mult_1*input_1 + mult_2*input_2 + constant
    # add some simulated noise
    noise = np.random.normal(loc=0.0,
                             scale=2.0,
                             size=time_steps.shape)

    output = output + noise

    # bundle the series into a single multivariate time series
    data_series = np.vstack((time_steps,
                             input_1,
                             input_2,
                             output)).transpose()

    #
    # np.vstack((array1, array2)) vertically stacks
    # array1 on top of array 2:
    #
    #  (array 1)
    #  (array 2)
    #
    # transpose() to convert rows to vertical columns
    #
    # data_series has rows:
    #    (date_time, input_1, input_2, output)
    #    ...
    #

    # the model fit will estimate the values for the
    # linear model parameters MULT_T, MULT_1, and MULT_2

    fitted_series, \
        fit_results = fit_linear_to_time_series(data_series)

    assert fitted_series.shape[1] == 2, "wrong number of columns"

    model_output = fitted_series[:, 1].flatten()

    #
    # Is the model "good enough" for practical use?
    #
    # Compure R-SQUARED also known as R**2
    # coefficient of determination, a goodness of fit measure
    # roughly percent agreement between data and model
    #
    r2 = r2_score(output,  # ground truth / data
                  model_output  # predicted values
                  )

    #
    # Plot data and model predictions
    #

    model_str = "OUTPUT = MULT_1*INPUT_1 + MULT_2*INPUT_2 + CONSTANT"

    f1 = plt.figure()
    # set light gray background for plot
    # must do this at start after plt.figure() call for some
    # reason
    #
    ax = plt.axes()  # get plot axes
    ax.set_facecolor("lightgray")  # confusingly use set_facecolor(...)
    # plt.ylim((ylow, yhi))  # debug code
    plt.plot(time_steps, output, 'g+', label='DATA')
    plt.plot(time_steps, model_output, 'b-', label='MODEL')
    plt.plot(time_steps, data_series[:, 1], 'cd', label='INPUT 1')
    plt.plot(time_steps, data_series[:, 2], 'md', label='INPUT 2')
    plt.suptitle(model_str)
    plt.title(f"Simple Linear Model (R**2={100*r2:.2f}%)")

    ax.text(1.05, 0.5,
            model_str,
            rotation=90, size=7, weight='bold',
            ha='left', va='center', transform=ax.transAxes)

    ax.text(0.01, 0.01,
            debug_prefix(),
            color='black',
            weight='bold',
            size=6,
            transform=ax.transAxes)

    ax.text(0.01, 0.03,
            time.ctime(),
            color='black',
            weight='bold',
            size=6,
            transform=ax.transAxes)

    plt.xlabel("YEAR FRACTION")
    plt.ylabel("OUTPUT")
    plt.legend(fontsize=8)
    # add major grid lines
    plt.grid()
    plt.show()

    image_file = "test_fit_linear_to_time_series.jpg"
    if os.path.isfile(image_file):
        print("WARNING: removing old image file:",
              image_file)
        os.remove(image_file)

    f1.savefig(image_file,
               dpi=150)

    if os.path.isfile(image_file):
        print("Wrote plot image to:",
              image_file)

    # END test_fit_linear_to_time_series()


if __name__ == "__main__":
    # MAIN PROGRAM

    test_fit_linear_to_time_series()  # test linear model fit

    print(debug_prefix(), time.ctime(), "ALL DONE!")
(C) 2022 by John F. McGowan, Ph.D.
About Me
John F. McGowan, Ph.D. solves problems using mathematics and mathematical software, including developing gesture recognition for touch devices, video compression and speech recognition technologies. He has extensive experience developing software in C, C++, MATLAB, Python, Visual Basic and many other programming languages. He has been a Visiting Scholar at HP Labs developing computer vision algorithms and software for mobile devices. He has worked as a contractor at NASA Ames Research Center involved in the research and development of image and video processing algorithms and technology. He has published articles on the origin and evolution of life, the exploration of Mars (anticipating the discovery of methane on Mars), and cheap access to space. He has a Ph.D. in physics from the University of Illinois at Urbana-Champaign and a B.S. in physics from the California Institute of Technology (Caltech).
This is EMACS code and text editor LISP code to convert a space delimited text table into working Python code in EMACS. By default, it binds the python-table function below to the CTRL-= key sequence in EMACS for easy use. Add this code to your dot emacs EMACS startup file (~/.emacs). Restart EMACS to load the new dot emacs startup file.
Select the text data table in EMACS using rectangle-mark-mode — bound to CTRL-SPACEBAR by default — and press CTRL-= to convert the selected text data table to a Python NumPy fast numerical array definition. The emacs LISP function python-table automates the steps shown in the previous post “[Video] How to Copy and Paste Data Tables into Working Python Code with EMACS.”
(defun python-table-rows (inputStr)
  "Convert space delimited text table to working Python fast NumPy array definition code"
  (interactive "e")
  (setq head "table_name = np.array([\n")
  ;; replace thousands separator comma (,) with Python separator underscore (_)
  (setq temp1 (replace-regexp-in-string "," "_" inputStr))
  ;; enclose each row in [ (row) ],
;;  (setq temp2 (replace-regexp-in-string "\\(.*\\)" "[\\1]," temp1))
  (setq temp2 (replace-regexp-in-string "\\([a-zA-Z0-9_ \\.]*\\)" "[\\1]," temp1))
  ;; remove any spurious [],
  (setq temp2b (replace-regexp-in-string "\\[\\]," "" temp2))
  ;; convert repeated space delimeters to (comma)(space)
  (setq temp3 (replace-regexp-in-string " +" ", " temp2b))
  ;;  add ] to close list of lists, close paren ) to convert to numpy array
  (setq tail "])")
  ;; build entire Python code block
  (setq temp4 (concat head temp3))
  (setq temp5 (concat temp4 tail))
  ) ;; end defun python-table

(defun python-table ()
  " convert selected region with space separated text table to python code "
  (interactive)
  (message "running python-table") ;; progress message
  ;; use buffer-substring-no-properties to strip fonts etc.
  ;; get text from selected region and put in tmp variable
  (setq tmp (buffer-substring-no-properties (mark) (point)))
  ;; convert to Python Code and put in table variable
  (setq table (python-table-rows tmp))
  (message table) ;; progress message
  (delete-region (mark) (point))  ;; remove the region contents
  (insert table)  ;; replace with python code table definition
  ) ;; end defun ptable()

(global-set-key (kbd "C-=") 'python-table) ;; bind python-table to hot key
Use CTRL-X CTRL-F~/.emacs RETURN to read in, display, and edit your dot emacs file in the EMACS editor.
How to Use
Add this code to your dot emacs file. Modify as appropriate if you know what you are doing.
Restart emacs.
Use the EMACS rectangle-mark-mode command — usually bound to CTRL-X SPACEBAR in EMACS — to select a rectangular text table as in the text below. Use Edit Menu | Copy or ESC-W to copy the text data table in EMACS.
This is an example of selecting, copying, and pasting a text table
into Python source code using the Emacs code and text editor.

Python is a popular programming language. With add on packages
such as NumPy, SciPy, and Matplotlib, it is a leading tool
for data analysis, scientific and numerical programming.

Demo Text Table
0.5      276
2.5      328
6.5      134
12.0     139
17.0   1,807 random notes here
22.0   3,342
29.5   5,340 commentary here
39.5   3,316
49.5   2,106
59.5   1,360 doodling here
69.5     562
79.5     270
89.5     120

This data is so great.

Three ways to select a rectangular text region in Emacs:

ESC-x rectangle-mark-mode
CTRL-X SPACE
SHIFT-(mouse drag)

URL: http://www.mathematical-software.com/
Use CTRL-y to paste the selected text table into Python code. Select the table and use CTRL-= to convert to working Python source code — a NumPy fast array definition with the values from the text table. The Python add-on packages NumPy, SciPy and MatPlotLib provide extensive numerical and statistical analysis functions and plotting.
(C) 2021 by John F. McGowan, Ph.D.
About Me
John F. McGowan, Ph.D. solves problems using mathematics and mathematical software, including developing gesture recognition for touch devices, video compression and speech recognition technologies. He has extensive experience developing software in C, C++, MATLAB, Python, Visual Basic and many other programming languages. He has been a Visiting Scholar at HP Labs developing computer vision algorithms and software for mobile devices. He has worked as a contractor at NASA Ames Research Center involved in the research and development of image and video processing algorithms and technology. He has published articles on the origin and evolution of life, the exploration of Mars (anticipating the discovery of methane on Mars), and cheap access to space. He has a Ph.D. in physics from the University of Illinois at Urbana-Champaign and a B.S. in physics from the California Institute of Technology (Caltech).
How to Tell Scientifically if Advertising Works Explainer Video
[Slide 1]
“Half the money
I spend on advertising is wasted; the trouble is I don’t know which
half.”
This popular quote
sums up the problem with advertising.
[Slide 2]
There are many
advertising choices today including not advertising, relying on word
of mouth and other “organic” growth. Is the advertising
working?
[Slide 3]
Proxy measures such
as link clicks can be highly misleading. A bad advertisement can get
many clicks, even likes but reduce sales by making the product look
bad in an entertaining way.
[Animation Enter]
[Wait 2 seconds]
[Slide 4]
Did the advertising
increase sales and profits? This requires analysis of the product
sales and advertising expenses from your accounting program such as
QuickBooks. Raw sales reports are often difficult to interpret
unless the boost in sales is extremely large such as doubling sales.
Sales are random like flipping a coin. This means a small but
profitable increase such as twenty percent is often difficult to
distinguish from chance alone.
[Slide 5]
Statistical analysis
and computer simulation of a business can give a quantitative,
PREDICTIVE answer. We can measure the fraction of days with zero,
one, two, or more unit sales with advertising — the green bars in
the plot shown — and without advertising, the blue bars.
[Slide 6]
With these
fractions, we can simulate the business with and without advertising.
The bar chart shows
the results for one thousand simulations of a year of business
operations. Because sales are random like flipping a coin, there
will be variations in profit from simulation to simulation due to
chance alone.
The horizontal axis
shows the change in profits in the simulation compared to the actual
sales without advertising. The height of the bars shows the FRACTION
of the simulations with the change in profits on the horizontal axis.
The blue bars are
the fractions for one-thousand simulations without advertising.
[Animation Enter]
The green bars are
the fractions for one-thousand simulations with advertising.
[Animation Enter]
The vertical red bar
shows the average change in profits over ALL the simulations WITH THE
ADVERTISING.
There is ALWAYS an
increased risk from the fixed cost of the advertising — $500 per
month, $6,000 per year in this example. The green bars in the lower
left corner show the increased risk with advertising compared to the
blue bars without advertising.
If the advertising
campaign increases profits on average and we can afford the increased
risk, we should continue the advertising.
[Slide 7]
This analysis was
performed with Mathematical Software’s AdEvaluator Free Open Source
Software. AdEvaluator works for sales data where there is a SINGLE
change in the business, a new advertising campaign.
Our AdEvaluator Pro
software for which we will charge money will evaluate cases with
multiple changes such as a price change and a new advertising
campaign overlapping.
Click on the
Downloads TAB for our Downloads page.
[Web Site Animation
Exit]
[Download Links
Animation Entrance]
AdEvaluator can be
downloaded from GitHub or as a ZIP file directly from the downloads
page on our web site.
[Download Links
Animation Exit]
Or scan this QR code
to go to the Downloads page.
This is John F.
McGowan, Ph.D., CEO of Mathematical Software. I have many years
experience solving problems using mathematics and mathematical
software including work for Apple, HP Labs, and NASA. I can be
reached at ceo@mathematical-software.com
John F. McGowan, Ph.D. solves problems using mathematics and mathematical software, including developing gesture recognition for touch devices, video compression and speech recognition technologies. He has extensive experience developing software in C, C++, MATLAB, Python, Visual Basic and many other programming languages. He has been a Visiting Scholar at HP Labs developing computer vision algorithms and software for mobile devices. He has worked as a contractor at NASA Ames Research Center involved in the research and development of image and video processing algorithms and technology. He has published articles on the origin and evolution of life, the exploration of Mars (anticipating the discovery of methane on Mars), and cheap access to space. He has a Ph.D. in physics from the University of Illinois at Urbana-Champaign and a B.S. in physics from the California Institute of Technology (Caltech).
John Wanamaker, (attributed) US department store merchant (1838 – 1922)
Between $190 billion and $270 billion is spent on advertising in the United States each year (depending on source). It is often hard to tell whether the advertising boosts sales and profits. This is caused by the unpredictability of individual sales and in many cases the other changes in the business and business environment occurring in addition to the advertising. In technical terms, the evaluation of the effect of advertising on sales and profits is often a multidimensional problem.
Many common metrics such as the number of views, click through rates (CTR), and others do not directly measure the change in sales or profits. For example, an embarrassing or controversial video can generate large numbers of views, shares, and even likes on a social media site and yet cause a sizable fall in sales and profits.
Because individual sales are unpredictable, it is often difficult or impossible to tell whether a change in sales is caused by advertising, simply due to chance alone or some combination of advertising and luck.
The plot below shows the simulated daily sales for a product or service with a price of $90.00 per unit. Initially, the business has no advertising, relying on word of mouth and other methods to acquire and retain customers. During this “no advertising” period, an average of three units are sold per day. The business then contracts with an advertising service such as Facebook, Google AdWords, Yelp, etc. During this “advertising” period, an average of three and one half units are sold per day.
Daily Sales
The raw daily sales data is impossible to interpret. Even looking at the thirty day moving average of daily sales (the black line), it is far from clear that the advertising campaign is boosting sales.
Taking the average daily sales over the “no advertising” period, the first six months, and over the “advertising” period (the blue line), the average daily sales was higher during the advertising period.
Is the increase in sales due to the advertising or random chance or some combination of the two causes? There is always a possibility that the sales increase is simply due to chance. How much confidence can we have that the increase in sales is due to the advertising and not chance?
This is where statistical methods such as Student’s T test, Welch’s T test, mathematical modeling and computer simulations are needed. These methods compute the effectiveness of the advertising in quantitative terms. These quantitative measures can be converted to estimates of future sales and profits, risks and potential rewards, in dollar terms.
Measuring the Difference Between Two Random Data Sets
In most cases, individual sales are random events like the outcome of flipping a coin. Telling whether sales data with and without advertising is the same is similar to evaluating whether two coins have the same chances of heads and tails. A “fair” coin is a coin with an equal chance of giving a head or a tail when flipped. An “unfair” coin might have a three fourths chance of giving a head and only a one quarter chance of giving a tail when flipped.
If I flip each coin once, I cannot tell the difference between the fair coin and the unfair coin. If I flip the two coins ten times, on average I will get five heads from the fair coin and seven and one half (seven or eight) heads from the unfair coin. It is still hard to tell the difference. With one hundred times, the fair coin will average fifty heads and the unfair coin seventy-five heads. There is still a small chance that the seventy five heads came from a fair coin.
The T statistics used in Student’s T test (Student was a pseudonym used by statistician William Sealy Gossett) and Welch’s T test, a more advanced T test, are measures of the difference in a statistical sense between two random data sets, such as the outcome of flipping coins one hundred times. The larger the T statistic the more different the two random data sets in a statistical sense.
William Sealy Gossett (Student)
Student’s T test and Welch’s T test convert the T statistics into probabilities that the difference between the two data sets (the “no advertising” and “advertising” sales data in our case) is due to chance. Student’s T test and Welch’s T test are included in Excel and many other financial and statistical programs.
The plot below is a histogram (bar chart) of the number of simulations with a Welch’s T statistic value. In these simulations, the advertising has no effect on the daily sales (or profits). The advertising has no effect is the null hypothesis in the language of classical statistics.
Welch’s T Statistics
Welch was able to derive a mathematical formula for the expected distribution — shape of this histogram — using calculus. The mathematical formula could then be evaluated quickly with pencil and paper or an adding machine, the best available technology of his time (the 1940’s).
To derive his formula using calculus, Welch had to assume that the data had a Bell Curve (Normal or Gaussian) distribution. This is at best only approximately true for the sales data above. The distribution of daily sales in the simulated data is actually the Poisson distribution. The Poisson distribution is a better model of sales data and approximates the Bell Curve as the number of sales gets larger. This is why Welch’s T test is often approximately valid for sales data.
Many methods and tests in classical statistics assume a Bell Curve (Normal or Gaussian) distribution and are often approximately correct for real data that is not Bell Curve data. We can compute better, more reliable results with computer simulations using the actual or empirical probability distributions — shown below.
Welch’s T Statistic has Bell Curve Shape
More precisely, naming one data set the reference data and the other data set the test data, the T test computes the probability that the test data is due to a chance variation in the process that produced the reference data set. In the advertising example above, the “no advertising” period sales data is the reference data and the “advertising” sales data is the test data. Roughly this probability is the fraction of simulations in the Welch’s T statistic histogram that have a T statistic larger (or smaller for a negative T statistic) than the measured T statistic for the actual data. This probability is known as a p-value, a widely used statistic pioneered by Ronald Fisher.
Ronald Aylmer Fisher at the start of his career
The p-value has some obvious drawbacks for a business evaluating the effectiveness of advertising. At best it only tells us the probability that the advertising boosted sales or profits, not how large the boost was nor the risks. Even if on average the advertising boosts sales, what is the risk the advertising will fail or the sales increase will be too small to recover the cost of the advertising?
Fisher worked for Rothamsted Experimental Station in the United Kingdom where he wanted to know whether new breeds of crops, fertilizers, or other new agricultural methods increased yields. His friend and colleague Gossett worked for the Guinness beer company where he was working on improving yields and quality of beer. In both cases, they wanted to know whether a change in the process had a positive effect, not the size of the effect. Without modern computers — using only pencil and paper and adding machines — it was not practical to perform simulations as we can easily today.
Welch’s T statistic has a value of -3.28 for the above sales data. This is in fact lower than nearly all the simulations in the histogram. It is very unlikely the boost in sales is due to chance. The p-value from Welch’s T test for the advertising data above — computed using Welch’s mathematical formula — is only 0.001 (one tenth of one percent). Thus it is very likely the boost in sales is caused by the advertising and not random chance. Note that this does not tell us if the size of the boost, whether the advertising is cost effective, or the risk of the investment.
Sales and Profit Projections Using Computer Simulations
We can do much better than Student’s T test and Welch’s T test by using computer simulations based on the empirical probabilities of sales from the reference data — the “no advertising” period sales data. The simulations use random number generators to simulate the random nature of individual sales.
In these simulations, we simulate one year of business operations with advertising many times — one-thousand in the examples shown — using the frequency of sales from the period with advertising. We also simulate one year of business operations without the advertising, using the frequency of sales from the period without advertising in the sales data.
Frequency of Daily Sales in Both Periods
We compute the annual change in the profit relative to the corresponding period — with or without advertising — in the sales data for each simulated year of business operations.
Annual Profit Projections
The simulations show that we have an average expected increase in profit of $5,977.66 over one year (our annual advertising cost is $6,000.00). It also shows that despite this there is a risk of a decrease in profits, some greater than the possible decreases with no advertising.
A business needs to know both the risks — how much money might be lost in a worst case — and the rewards — the average and best possible returns on the advertising investment.
Since sales are a random process like flipping a coin or throwing dice, there is a risk of a decline in profits or actual losses without the advertising. The question is whether the risk with advertising is greater, smaller, or the same. This is known as differential risk.
The Problem with p-values
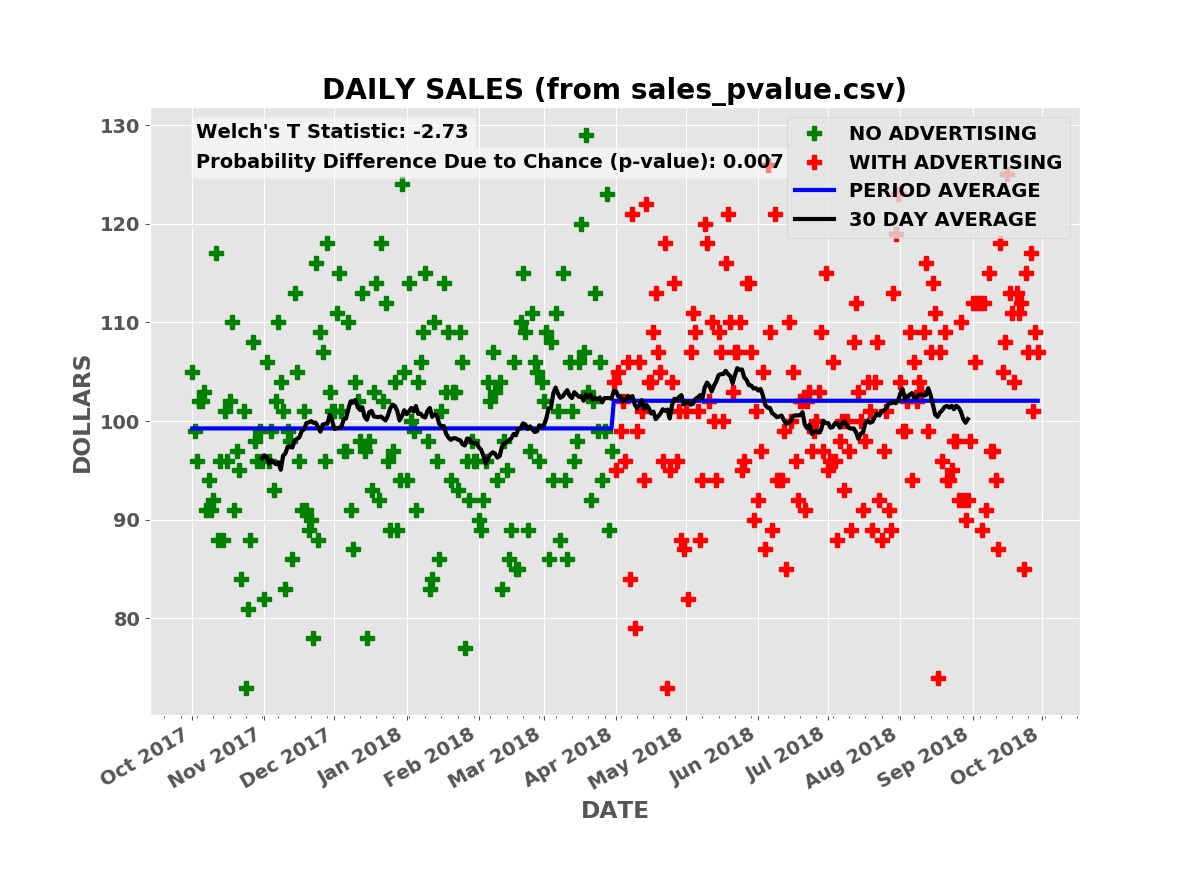
This is a concrete example of the problem with p-values for evaluating the effectiveness of advertising. In this case, the advertising increases the average daily sales from 100 units per day to 101 units per day. Each unit costs one dollar (a candy bar for example).
P-VALUE SHOWS BOOST IN SALES
The p-value from Welch’s T test is 0.007 (seven tenths of one percent). The advertising is almost certainly effective but the boost in sales is much less than the cost of the advertising:
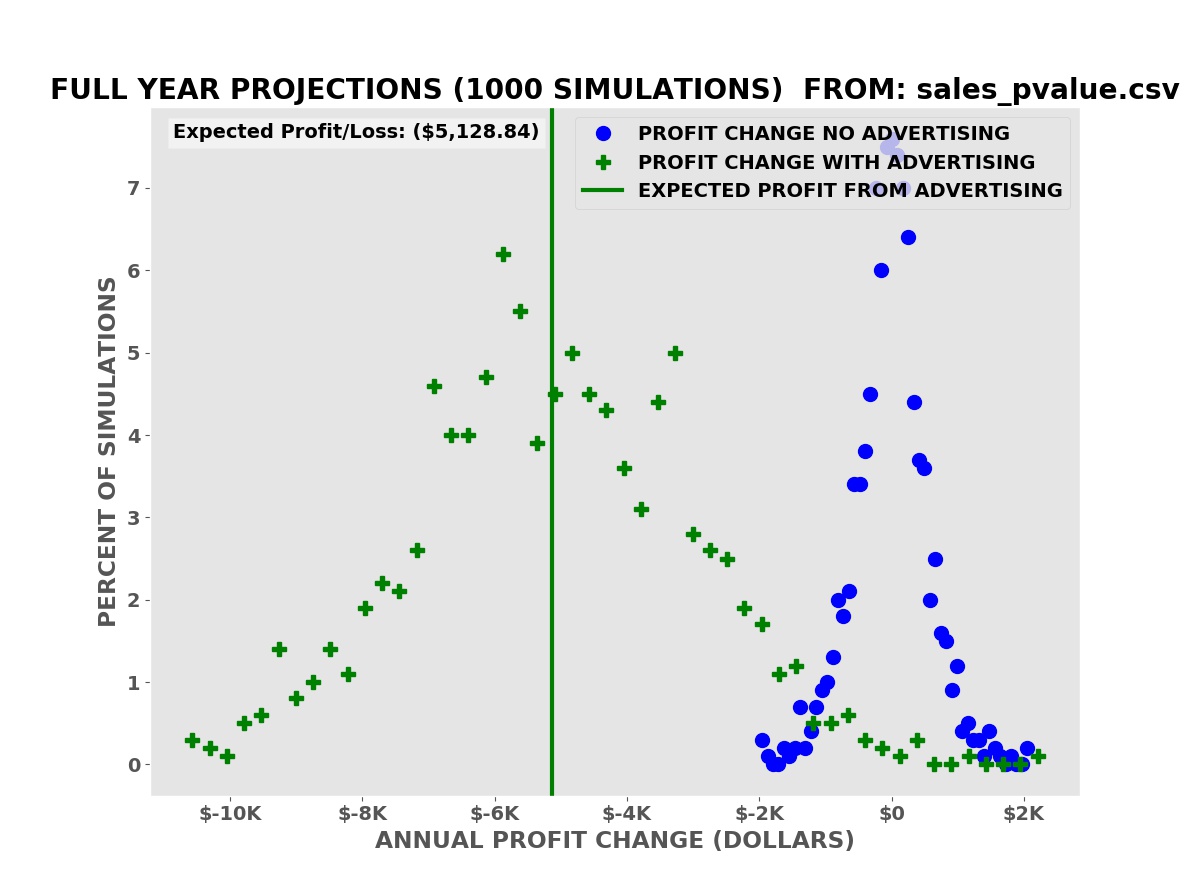
Profit Projections
The average expected decline in profits over the simulations is $5,128.84.
The p-value is not a good estimate of the potential risks and rewards of investing in advertising. Sales and profit projections from computer simulations based on a mathematical model derived from the reference sales data are a better (not perfect) estimate of the risks and rewards.
Multidimensional Sales Data
The above examples are simple cases where the only change is the addition of the advertising. There are no price changes, other advertising or marketing expenses, or other changes in business or economic conditions. There are no seasonal effects in the sales.
Student’s T test, Welch’s T test, and many other statistical tests are designed and valid only for simple controlled cases such as this where there is only one change between the reference and test data. These tests were well suited to data collected at the Rothamsted Experimental Station, Guinness breweries, and similar operations.
Modern businesses purchasing advertising from Facebook, other social media services, and modern media providers (e.g. the New York Times) face more complex conditions with many possible input variables (unit price, weather, unemployment rate, multiple advertising services, etc.) changing frequently or continuously.
For these, financial analysts need to extract predictive multidimensional mathematical models from the data and then perform similar simulations to evaluate the effect of advertising on sales and profits.
AdEvaluator™ is designed for cases with a single product or service with a constant unit price during both periods. AdEvaluator™ needs a reference period without the new advertising and a test period with the new advertising campaign. The new advertising campaign should be the only significant change between the two periods. AdEvaluator™ also assumes that the probability of the daily sales is independent and identically distributed during each period. This is not true in all cases. Exercise your professional business judgement whether the results of the simulations are applicable to your business.
This program comes with ABSOLUTELY NO WARRANTY; for details use -license option at the command line or select Help | License… in the graphical user interface (GUI). This is free software, and you are welcome to redistribute it under certain conditions.
We are developing a professional version of AdEvaluator™ for multidimensional cases. This version uses our Math Recognition™ technology to automatically identify good multidimensional mathematical models.
The Math Recognition™ technology is applicable to many types of data, not just sales and advertising data. It can for example be applied to complex biological systems such as the blood coagulation system which causes heart attacks and strokes when it fails. According the US Centers for Disease Control (CDC) about 633,000 people died from heart attacks and 140,000 from strokes in 2016.
Conclusion
It is often difficult to evaluate whether advertising is boosting sales and profits, despite the ready availability of sales and profit data for most businesses. This is caused by the unpredictable nature of individual sales and frequently by the complex multidimensional business environment where price changes, economic downturns and upturns, the weather, and other factors combine with the advertising to produce a confusing picture.
In simple cases with a single change, the addition of the new advertising, Student’s T test, Welch’s T test and other methods from classical statistics can help evaluate the effect of the advertising on sales and profits. These statistical tests can detect an effect but provide no clear estimate of the magnitude of the effect on sales and profits and the financial risks and rewards.
Sales and profit projections based on computer simulations using the empirical probability of sales from the actual sales data can provide quantitative estimates of the effect on sales and profits, including estimates of the financial risks (chance of losing money) and the financial rewards (typical and best case profits).
(C) 2018 by John F. McGowan, Ph.D.
About Me
John F. McGowan, Ph.D. solves problems using mathematics and mathematical software, including developing gesture recognition for touch devices, video compression and speech recognition technologies. He has extensive experience developing software in C, C++, MATLAB, Python, Visual Basic and many other programming languages. He has been a Visiting Scholar at HP Labs developing computer vision algorithms and software for mobile devices. He has worked as a contractor at NASA Ames Research Center involved in the research and development of image and video processing algorithms and technology. He has published articles on the origin and evolution of life, the exploration of Mars (anticipating the discovery of methane on Mars), and cheap access to space. He has a Ph.D. in physics from the University of Illinois at Urbana-Champaign and a B.S. in physics from the California Institute of Technology (Caltech).
It is common to encounter claims of a shortage or projected shortage of some number of millions of STEM (Science, Technology, Engineering and Mathematics) workers — sometimes phrased as millions of new jobs that may go unfilled due to the shortage of STEM workers. For example, the recent press release from Emerson Electric claiming a STEM worker shortage crisis includes the following paragraph:
While the survey found students today are twice as likely to study STEM fields compared to their parents, the number of roles requiring STEM expertise is growing at a rate that exceeds current workforce capacity. In manufacturing alone, the National Association of Manufacturing and Deloitte predict the U.S. will need to fill about 3.5 million jobs by 2025; yet as many as 2 million of those jobs may go unfilled, due to difficulty finding people with the skills in demand.
Here are the numbers for United States students achieving a score of at least 3 out of 5, considered a passing grade — qualified, on the Advanced Placement (AP) Calculus exam, either the AB or the more advanced BC Calculus exam from the College Board. BC Calculus is equivalent to a full first year calculus course at a top STEM university or college such as MIT or Caltech. A score of 3 on an AP exam officially means “qualified.”
Calculus is a challenging college level quantitative course. Being rated as qualified or better in calculus is a substantial accomplishment. Calculus is taken by most STEM students regardless of specific STEM degree or profession. Mastering calculus demonstrates motivation, hard work, and innate ability. Calculus is required for many STEM degrees and professions. Calculus is “good to know” for nearly all STEM degrees and professions, even if not strictly required.
The AP exams are standardized tests taken by students throughout the United States, thus removing concerns about the quality of grades and certifications from differing institutions and teachers.
AP Calculus Totals by Year (Source: The College Board)
In 2016, about 284,000 students scored 3 or higher on the AP Calculus Exam, either the AB or the more advanced BC exam. In total, just over three million students scored 3 or higher on the AP Calculus exams from 2002 through 2016.
Here are the results of fitting a simple exponential growth model to the data to estimate the number of students who have received a score of 3 or higher on the AP Calculus Exam each year since 1970:
US K-12 STEM Student Production Data and Model 1970 to 2016
This model estimates a total of just over five (5) million students scoring 3 or higher on the AP Calculus Exams since 1970 (48 years ago). The model has a coefficient of determination of 0.988, meaning only 1.2 percent of the variation in the data is unexplained by the model. This is excellent agreement between the model and data.
The model predicts that about 4.2 million students will take the AP Calculus Exam and score 3 or higher between 2016 and 2026 (far more than the 2 million and 3.5 million numbers quoted in the Emerson press release). This is in addition to the over 3 million students the College Board says took the exam and scored 3 or better between 2002 and 2016 and the estimated 2 million between 1970 and 2002.
The United States produces many qualified STEM students at the K-12 level!
In 2016, the United States Bureau of Labor Statistics (BLS), arguably a more reliable and authoritative source than the Emerson press release, predicted the total number of STEM jobs would grow by 853,600 jobs from 2016 to 2026 ( a ten year prediction). This is considerably less than the four million students expected to score 3 or higher on AP Calculus between 2016 and 2026.
The BLS estimates that there were 7.3 million science and engineering workers employed in 2016, with a projected increase to 8.2 million in 2026.
The BLS also predicted that an additional 1.439 million scientists and engineers will exit the labor force due to factors such as retirement, death, and to care for family members . This is plausible assuming the science and engineering workforce has ages roughly uniformly distributed between 22 (typical college graduation age) and 65 (typically retirement age). In ten years, about a quarter of the science and engineering workforce might be expected to retire, die, or leave to care for family members. One quarter of 7.3 million is about 1.825 million.
Taken together overall growth (835,000) and retirements, deaths, etc. (about 1.8 million) give a total of about 2.635 million openings, considerably lessthan the predicted four million students who will take AP Calculus and score 3 or higher between 2016 and 2026. In fact, extrapolating the 284,000 students who scored 3 or higher on the AP Calculus Exam in 2016 forward for ten years with no growth (an unrealistic assumption) still gives 2.8 million students, more than the projected number of openings.
Occupational Transfers
However, the BLS then introduces a remarkable, if not bizarre additional category of projected “openings.” Here is John Sargent of the Congressional Research Service (CRS)’s discussion of the BLS projections:
In addition to the job openings created by growth in the number of jobs in S&E occupations, BLS projects that an additional 1. 439 million scientists and engineers will exit the labor force due to factors such as retirement, death, and to care for family members . This brings the number of S&E job openings created by job growth and those exiting the workforce to nearly 2.3 million. In addition, BLS projects that there will be an additional 3.7 million openings created by occupational transfers in S&E positions during this period, that is , workers in S&E occupations who leave their jobs to take jobs in different occupations, S&E or non-S&E. The BLS projections do not include data that allow for a quantitative analysis of how many new workers (those not in the labor market in 2016) will be required for openings created by job growth, labor force exits, and occupational transfers , as there is no detail to how many of the S&E openings are expected to be filled by workers transferring into these openings from S&E occupations and from non-S&E occupations (that is, some workers may transfer from one S&E occupation to another, some may transfer from an S&E occupations to a non-S&E occupations, and still others may transfer from a non-S&E occupation into an S&E occupations ) . According to BLS, the projections methodology allows for multiple occupational transfers from the same position during the 10-year projection period, but only one occupational transfer in a given year.
The BLS appears to be claiming that at least 3.7 million allegedly rare and difficult to find, highly paid STEM workers, over one half of currently employed STEM workers (7.3 million) will, for some unexplained reason — not retirement, death, or caring for a loved one — leave their profession!
This bizarre unexplained projection, now totaling six (6) million openings, finally manages to exceed the estimated four million students who will probably take AP Calculus and score 3 or better on the AP exam between 2016 and 2026.
Without the mysterious “occupational transfers,” the numbers actually suggest overproduction, a glut of STEM students at the K-12 level (more students taking the AP Calculus Exams and scoring 3 or higher than future openings).
The US Census found using the most common definition of STEM jobs, total STEM employment in 2012 was 5.3 million workers (immigrant and native), but there are 12.1 million STEM degree holders (immigrant and native). There are many more STEM degree holders than students who took AP Calculus and scored at least 3 on the exam! A majority of STEM degree holders do not work in STEM professions.
What should one make of this? The BLS seems to be assuming an extremely high turnover rate in STEM workers, with at least fifty percent dropping out or being pushed out in only ten years. This assumption may then be used to argue for a shortage! The shortage would be due entirely to the mysterious unexplained “occupational transfers.”
Conclusion
K-12 schools in the United States produce large numbers of highly qualified STEM students who routinely take and pass the AP Calculus exam, either the AB exam or the more advanced BC exam. Remarkably these top students alone are nearly able to fill all existing STEM jobs, not including guest workers on H1-B or other guest worker visas and not including many late bloomers who first take calculus in college or even graduate school.
NOTE: The raw data on numbers of students taking and passing the AP Calculus exams each year from 2002 to 2016 are in the Comma Separated Values (CSV) format and the Python model fitting script used in the analysis above are given in the Appendix below. The data follows the Python script.
(C) 2018 by John F. McGowan, Ph.D.
About Me
John F. McGowan, Ph.D. solves problems using mathematics and mathematical software, including developing gesture recognition for touch devices, video compression and speech recognition technologies. He has extensive experience developing software in C, C++, MATLAB, Python, Visual Basic and many other programming languages. He has been a Visiting Scholar at HP Labs developing computer vision algorithms and software for mobile devices. He has worked as a contractor at NASA Ames Research Center involved in the research and development of image and video processing algorithms and technology. He has published articles on the origin and evolution of life, the exploration of Mars (anticipating the discovery of methane on Mars), and cheap access to space. He has a Ph.D. in physics from the University of Illinois at Urbana-Champaign and a B.S. in physics from the California Institute of Technology (Caltech).
Appendix
estimate_k12_stem.py
#

# estimate total production of STEM students at the

# K-12 level (pre-college)

#

# data and model for number of students who pass the

# AP Calculus exams (both AB and BC) from the College

# Board each year (data from 2002 to 2016)

#

# estimate total production of STEM students by K-12

# education from 1970 to 2016 (about 5 million estimated)

#

# versus about 12.1 million STEM degree holders in 2014

# and 5.3 million actual employed STEM workers in 2014

#

# Source: https://cis.org/There-STEM-Worker-Shortage

#

# (C) 2018 by John F. McGowan, Ph.D. (ceo@mathematical-software.com)

#

#

import numpy as np

import matplotlib.pyplot as plt

import matplotlib.ticker as ticker
from mpl_toolkits.mplot3d import Axes3D
import scipy.optimize as opt
import pandas as pd
df = pd.read_csv(“AP Calculus Totals by Year.csv”)
df.dropna()
ab_str = df.values[:,2]
bc_str = df.values[:,4]
ab = np.zeros(ab_str.shape)
bc = np.zeros(bc_str.shape)
index = 0
for val in ab_str.ravel():
if isinstance(val, str):
ab[index] = np.float(val.replace(‘,’,”))
index += 1
index = 0
for val in bc_str.ravel():
if isinstance(val, str):
bc[index] = np.float(val.replace(‘,’, ”))
index += 1
temp = ab + bc
total = temp[:-2]
years_str = df.values[0:15,0]
years = np.zeros(years_str.shape)
for index in range(years.size):
years[index] = np.float(years_str[index])
# to match BLS projections
future_years = np.linspace(2016, 2026, 11)
assert future_years.size == 11
future_students = my_exp(future_years, *popt)
# https://fas.org/sgp/crs/misc/R43061.pdf
#
# The U.S. Science and Engineering Workforce: Recent, Current,
# and Projected Employment, Wages, and Unemployment
#
# by John F. Sargent Jr.
# Specialist in Science and Technology Policy
# November 2, 2017
#
# Congressional Research Service 7-5700 www.crs.gov R43061
#
# “In 2016, there were 6.9 million scientists and engineers (as
# defined in this report) employed in the United States, accounting
# for 4.9 % of total U.S. employment.”
#
# BLS astonishing/bizarre projections for 2016-2026
# “The Bureau of Labor Statistics (BLS) projects that the number of S&E
# jobs will grow by 853,600 between 2016 and 2026 , a growth rate
# (1.1 % CAGR) that is somewhat faster than that of the overall
# workforce ( 0.7 %). In addition, BLS projects that 5.179 million
# scientists and engineers will be needed due to labor force exits and
# occupational transfers (referred to collectively as occupational
# separations ). BLS projects the total number of openings in S&E due to growth ,
# labor force exits, and occupational transfers between 2016 and 2026 to be
# 6.033 million, including 3.477 million in the computer occupations and
# 1.265 million in the engineering occupations.”
# NOTE: This appears to project 5.170/6.9 or 75 percent!!!! of current STEM
# labor force LEAVE THE STEM PROFESSIONS by 2026!!!!
# “{:,}”.format(value) to specify the comma separated thousands format
#
print(“TOTAL Scientists and Engineers 2016:”, 6.9e6)
print(“ESTIMATED TOTAL IN 2016 SINCE “, START_YEAR, \
“{:,}”.format(cum_total))
print(“TOTAL FROM 2002 to 2016 (College Board Data) “, \
“{:,}”.format(total.sum()))
print(“ESTIMATED FUTURE STUDENTS (2016 to 2026):”, \
“{:,}”.format(future_students.sum()))
A brief introduction to the math recognition problem and automatic math recognition using modern artificial intelligence and pattern recognition methods. Includes a call for data. About 14 minutes.
(C) 2018 by John F. McGowan, Ph.D.
About Me
John F. McGowan, Ph.D. solves problems using mathematics and mathematical software, including developing gesture recognition for touch devices, video compression and speech recognition technologies. He has extensive experience developing software in C, C++, MATLAB, Python, Visual Basic and many other programming languages. He has been a Visiting Scholar at HP Labs developing computer vision algorithms and software for mobile devices. He has worked as a contractor at NASA Ames Research Center involved in the research and development of image and video processing algorithms and technology. He has published articles on the origin and evolution of life, the exploration of Mars (anticipating the discovery of methane on Mars), and cheap access to space. He has a Ph.D. in physics from the University of Illinois at Urbana-Champaign and a B.S. in physics from the California Institute of Technology (Caltech).