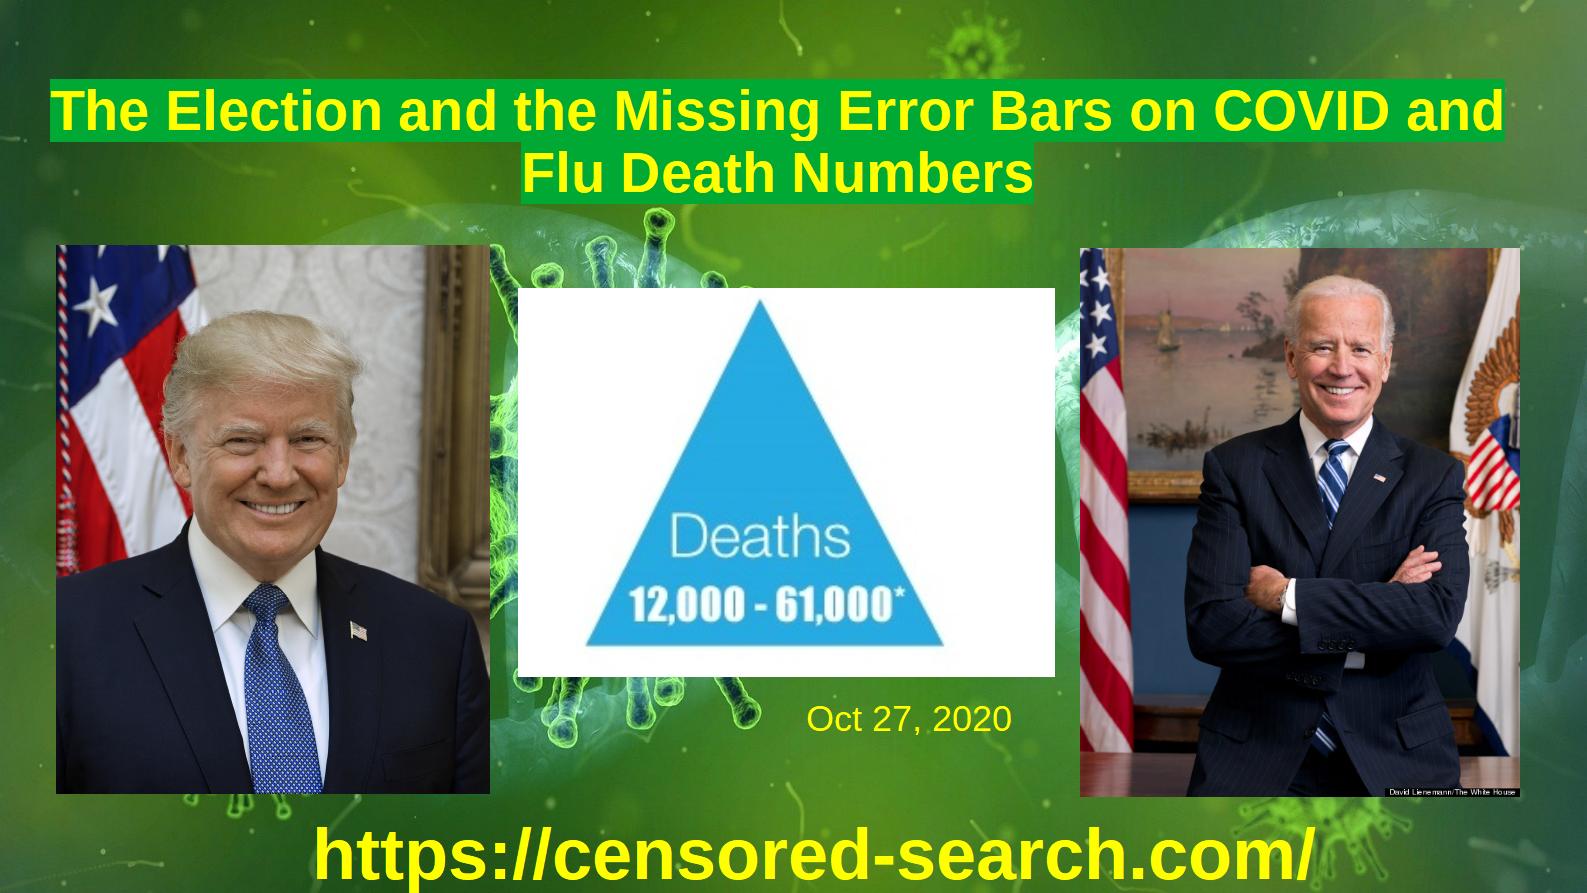
A video on the grossly contradictory CDC FluView pneumonia and influenza death numbers, implied to be influenza virus death numbers, and the CDC Leading causes of death report pneumonia and influenza death numbers, which differ by over a factor of THREE, the lack of reported error bars on the CDC flu and COVID death number counts, required by standard scientific practice, and the effect of this on the US Presidential election.
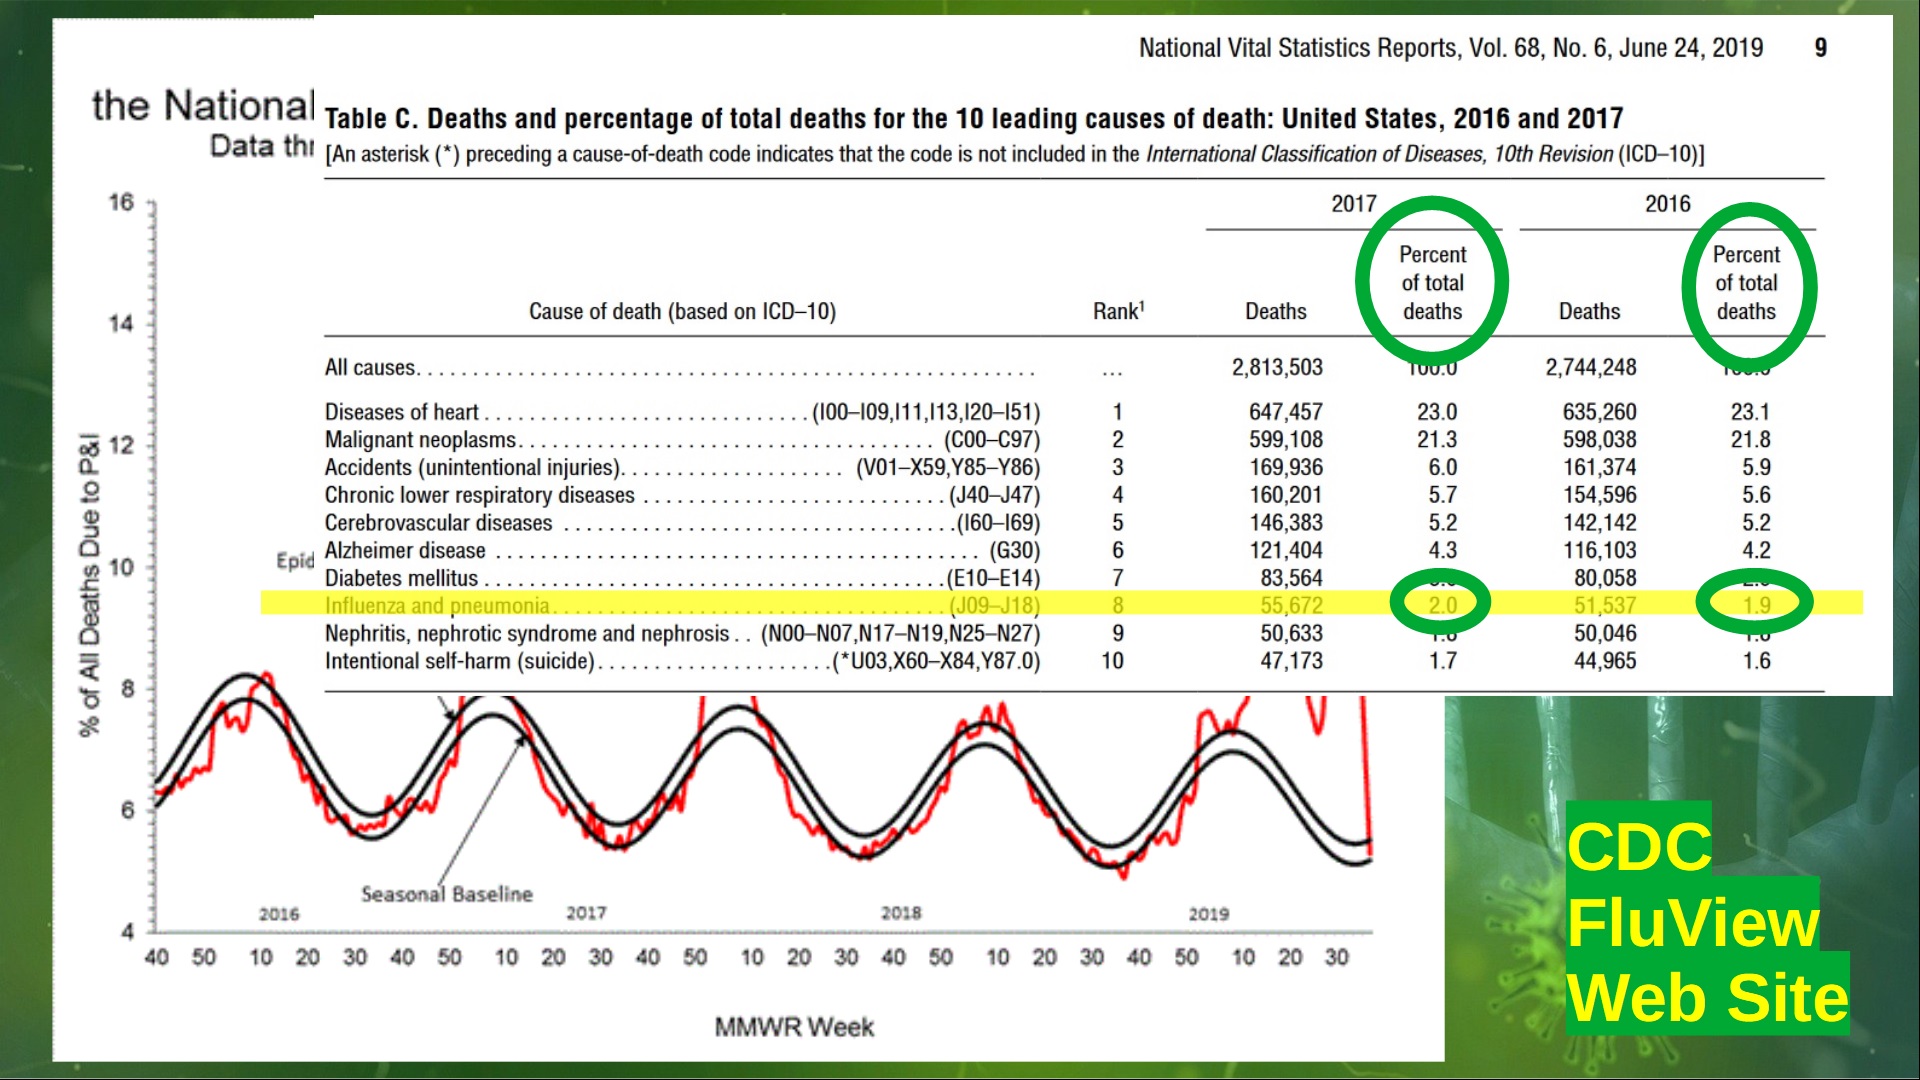
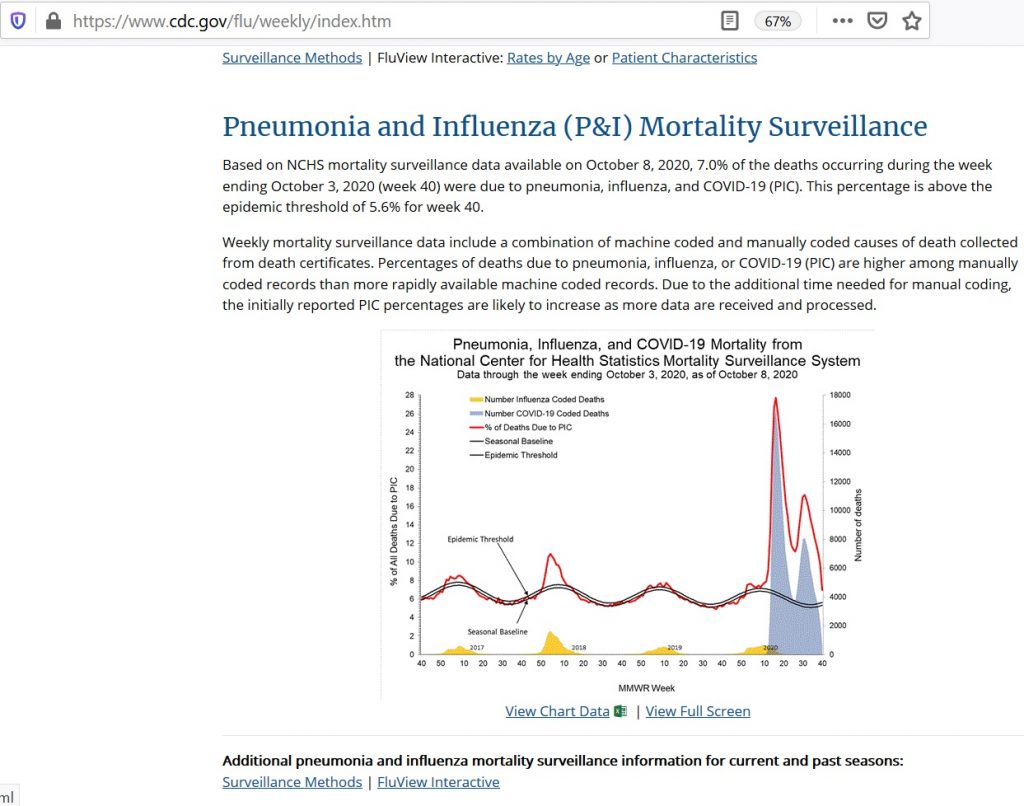
The FluView web site claims six to ten percent of all deaths are pneumonia and influenza in a prominently displayed graphic. However, the Leading Causes of Death report claims about two percent of deaths are caused by pneumonia and influenza, less than one third of the percentages reported on the FluView web site. No error bars are reported on these numbers.
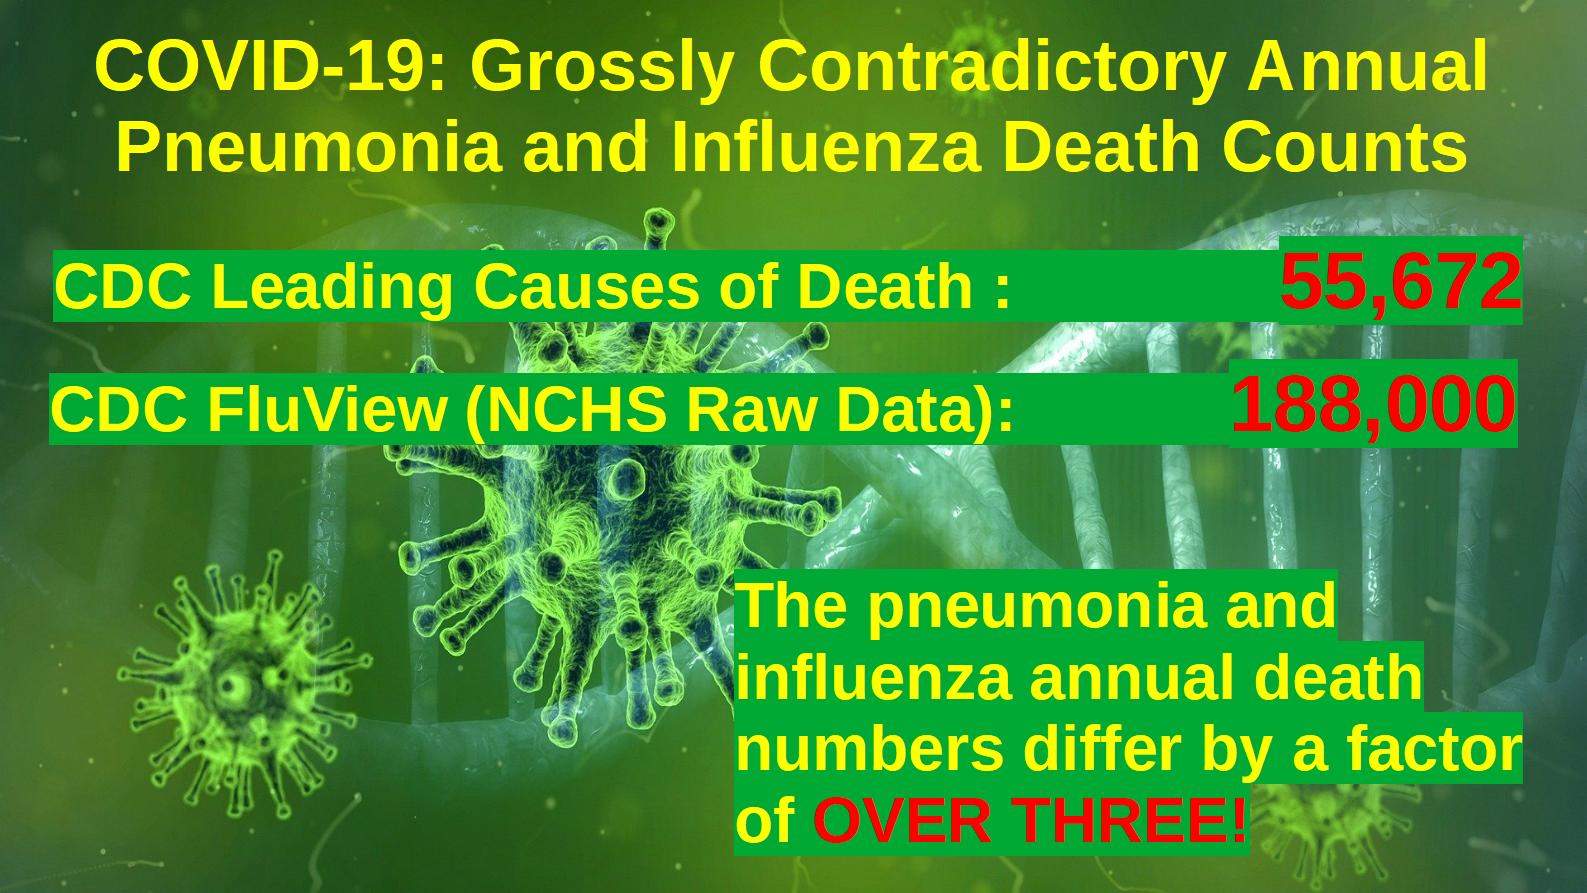
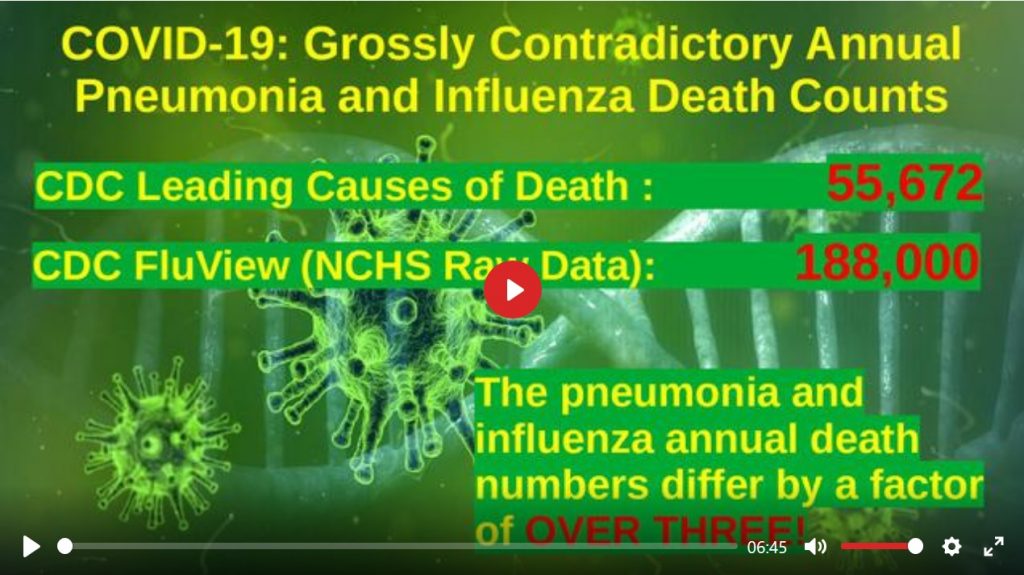
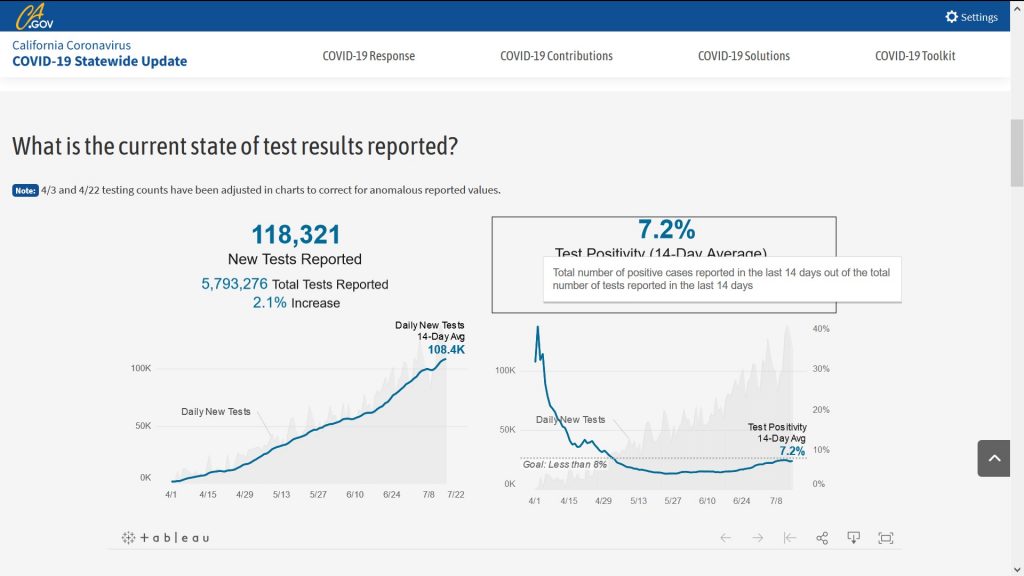
Looking at the numbers behind the percentages. The CDC uses two grossly contradictory numbers of annual deaths from pneumonia and influenza: about 55,000 in the annual leading causes of the death report and about 188,000 in National Center for Health Statistics (NCHS) data used on the FluView web site to report the percentage of deaths each week due to pneumonia and influenza. These differ by a factor of OVER THREE. The larger FluView number is comparable to the current cumulative total COVID-19 deaths in the United States frequently cited by the media and compared to a smaller number of about 40,000 “flu deaths.”
O Use of the flu death numbers in popular reporting on COVID and the election, usually lacking any error bars, is discussed.
o The CDC’s mysterious “flu death” mathematical model — a theory — assigning about 50,000 deaths per year to the influenza virus, mostly pneumonia deaths that lack a laboratory confirmed influenza infection, and the usually unreported errors on the output of this model is discussed.
o Evidence of large uncertainties in the assignment of cause of death by doctors, coroners and others is discussed. The lack of proper error bars due to this on both reported “flu death” numbers and COVID death numbers.
o Specific reasons why the CDC would likely be biased against President Trump due to his criticism of vaccine safety and historical statements on the possible role of childhood vaccines promoted by the CDC in causing autism are discussed.
Presentation Slides in Adobe Acrobat PDF Format:
References:
US CDC Disease Burden of Influenza (Mathematical Model of “Flu Deaths”)
https://www.cdc.gov/flu/about/burden/index.html
The most recent raw data appears to still be accessible on the FluView Pneumonia and Influenza Mortality web page:
https://www.cdc.gov/flu/weekly/index.htm (see Pneumonia and Influenza Mortality Section)
FluView NCHS Raw Data File: https://www.cdc.gov/flu/weekly/weeklyarchives2019-2020/data/NCHSData34.csv
Leading Causes of Death Full Report: https://www.cdc.gov/nchs/data/nvsr/nvsr68/nvsr68_06-508.pdf
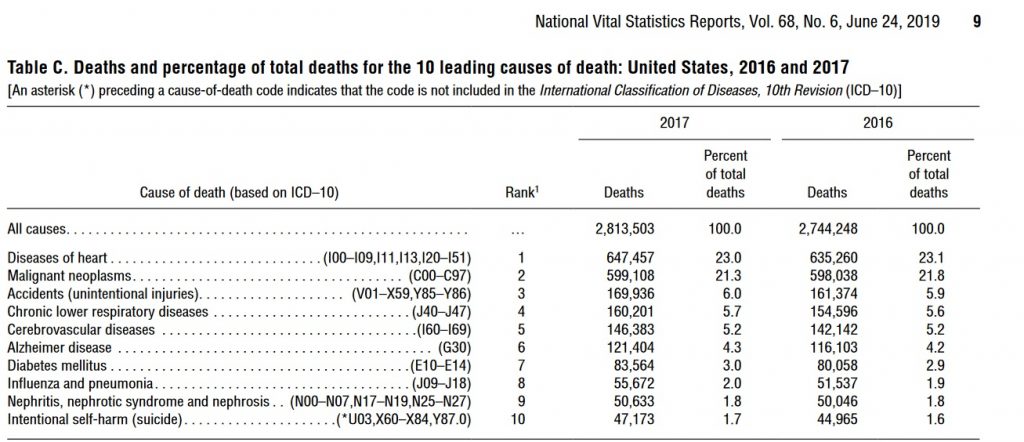
See Table C: Deaths and percentage of total deaths for the 10 leading causes of death: United States, 2016 and 2017 (Page 9 of PDF)
Line item 8 “Influenza and pneumonia” lists 55,672 deaths in 2017
My Article “The Mathematics of Autism” at the Math Blog: https://mathblog.com/the-mathematics-of-autism/
Avoid Internet Censorship by Subscribing to Our RSS News Feed: http://wordpress.jmcgowan.com/wp/feed/
Legal Disclaimers: http://wordpress.jmcgowan.com/wp/legal/
Support Us:
PATREON: https://www.patreon.com/mathsoft
SubscribeStar: https://www.subscribestar.com/mathsoft
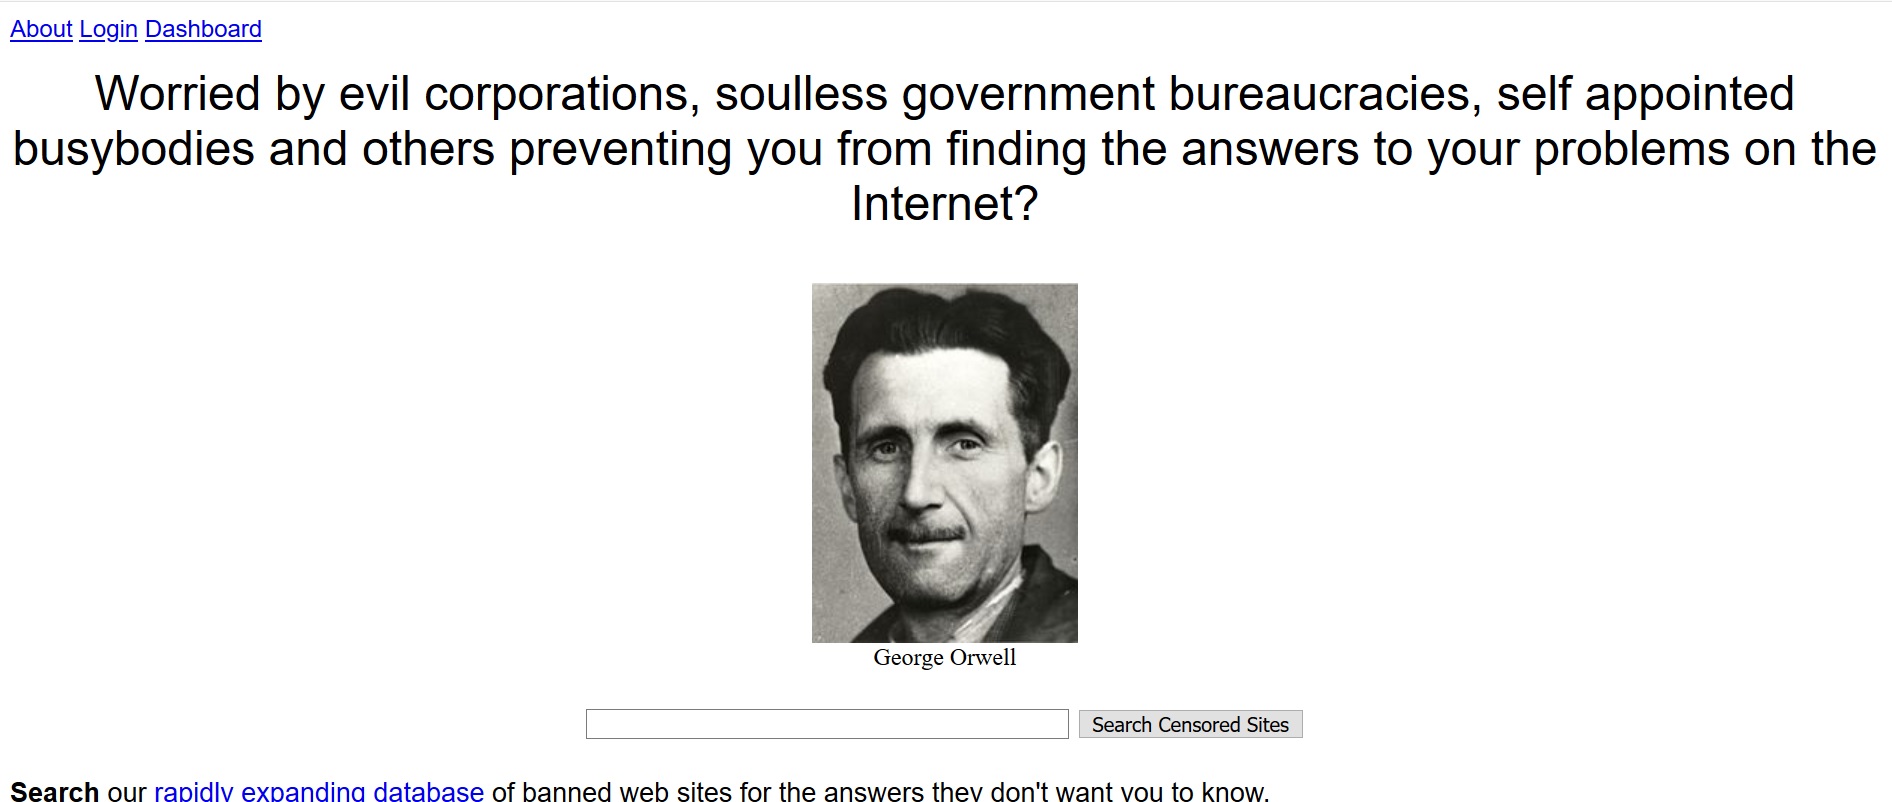
Subscribers gain access to the advanced professional features of our censored search web site and service — censored-search.com — a search engine for censored Internet content banned or shadow-banned by increasingly censored, advertising beholden social media and search engines such as Google, YouTube, and Facebook. The free version of censored-search.com — available to all — uses a modified page rank algorithm, essentially a popularity contest. The paid professional version includes advanced search algorithms to find and prioritize content that is probably being censored by vested interests because it is useful and true — for example, evidence that a product or service is harmful to users.
BitChute (Video): https://www.bitchute.com/channel/HGgoa2H3WDac/
Brighteon (Video): https://www.brighteon.com/channels/mathsoft
LBRY (Video): https://lbry.tv/@MathematicalSoftware:5
(C) 2020 by John F. McGowan, Ph.D.
About Me
John F. McGowan, Ph.D. solves problems using mathematics and mathematical software, including developing gesture recognition for touch devices, video compression and speech recognition technologies. He has extensive experience developing software in C, C++, MATLAB, Python, Visual Basic and many other programming languages. He has been a Visiting Scholar at HP Labs developing computer vision algorithms and software for mobile devices. He has worked as a contractor at NASA Ames Research Center involved in the research and development of image and video processing algorithms and technology. He has published articles on the origin and evolution of life, the exploration of Mars (anticipating the discovery of methane on Mars), and cheap access to space. He has a Ph.D. in physics from the University of Illinois at Urbana-Champaign and a B.S. in physics from the California Institute of Technology (Caltech).