Santa Clara County’s Remarkably Low COVID-19 Numbers
Santa Clara County, California has remarkably low COVID-19 death numbers despite extremely close ties to China and the many missteps in the response to the pandemic. I discuss this in detail and the possible reasons for the low numbers.
This is a written version with slides and notes (a PDF file). It is usually faster to read the written version than watch the video. The video may be clearer and more detailed on a few points. References are included in the written version.
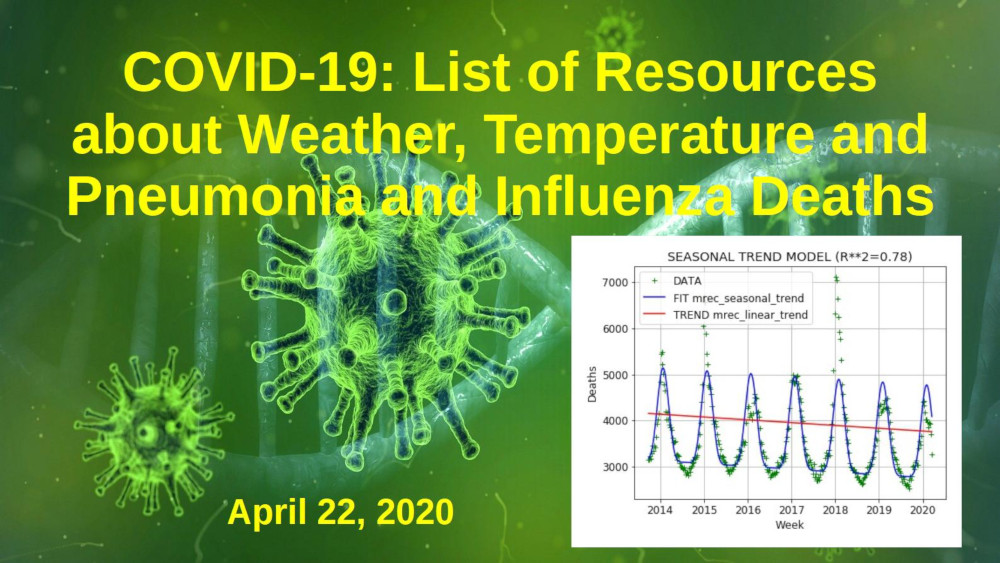
A key question about pneumonia and influenza (including the COVID-19 Sars-Cov-2 coronavirus disease) is the role of weather and temperature on the incidence, severity, and mortality rates from the diseases. Pneumonia and influenza cases and deaths are seasonal, peaking in the winter when sunlight levels and temperatures are lower. The curve for pneumonia and influenza deaths is roughly sinusoidal, which would be expected from something connected to sunlight levels. This is not what one would naively expect from children spreading the disease during the school year; we would expect an abrupt step up in the fall when kids return to school and a step down in the spring when school closes.
A previous post listed a number of resources on the possible direct effects of sunlight through vitamin D production and direct destruction of viruses and bacteria by sunlight, especially the ultraviolet component.
Seasonal Variation in Deaths from Pneumonia and Influenza (2014-2020)
There is a fair amount of research on the role of weather and temperature in the incidence, severity and mortality of pneumonia and influenza. Generally the research seems to support a positive correlation between lower temperatures and also rapid changes in temperature with higher incidence, severity and mortality from pneumonia and influenza as well as other causes of death, notably coronary disease. It also suggests extreme heat “heat waves” is positively correlated with pneumonia. Below are several scientific and scholarly articles; the interested reader can find more articles and details at PubMed (enter “pneumonia and weather” for example in the search box).
Note that correlation does not prove causation.
Scientific and Scholarly Articles
The Lancet
Volume 315, Issue 8183, 28 June 1980, Pages 1405-1408
Journal home page for The Lancet
Occasional Survey
THE WEATHER AND DEATHS FROM PNEUMONIA
Author links open overlay panelG.M.Bull
https://doi.org/10.1016/S0140-6736(80)92666-5
Age Ageing. 1978 Nov;7(4):210-24.
Environment, temperature and death rates.
Bull GM, Morton J.
Abstract
Analysis of recorded monthly deaths in England and Wales shows a close association of death rates with external temperature in most diseases other than the cancers. Analysis of daily deaths in England and Wales and in New York shows the following relationships between temperature and deaths from myocardial infarction, strokes and pneumonia. Between -10 degrees and +20 degrees C mimimum temperature there is a nearly linear fall in deaths as the temperature rises. Above 20 degrees C deaths rise steeply as the temperature rises and below -10 degrees C rise steeply as temperature falls. These associations of deaths with temperature are much stronger in the elderly than in younger subjects. Detailed analysis of the daily deaths in England and Wales from myocardial infarction, strokes and pneumonia show that short-term (1–2 days) temperature changes have little effect on death rates but medium-term (7–10 days) and longer-term (three or more weeks) changes associated with very significant changes in death rates. The three diseases vary in the time relations between temperature change and change in death rates. In all three there is an interval between the change in temperature and death and this is shortest in the case of myocardial infarction (1–2 days before death), longest in the case of pneumonia (about a week before death) and intermediate in the case of strokes (about 3–4 days before death). At low temperatures death rates increase as the duration of temperature change increases, while at high temperatures (but below +20 degrees C) death rates decrease as the period of temperature change is longer. The implications of these findings are discussed and it is postulated that there is probably causal relationship between temperature change and deaths from a wide variety of diseases. A proximal link in the chain is probably a failure of autonomic control of body temperature in the elderly leading to a change in body temperature and some humoral change which in turn leads to death. It is not appropriate to concentrate on hypothermia as the relationship between temperature and death is seen at all temperatures.
================================================= Age Ageing. 1975 Feb;4(1):19-31. Seasonal and short-term relationships of temperature with deaths from myocardial and cerebral infarction. Bull GM, Morton J. Abstract
In subjects over 60, changes in temperature lasting two or more days are associated with highly significant changes in death rates from myocardial infarction and cerbral vascular accidents. In both cases, the lower the temperature the higher the death rate and vice versa. Moreover the temperatures one to four days prior to the clinical onset of infarction are more relevant than that on the day of onset, a fact which may have a bearing on prophylaxis. In the case of strokes, a high temperature on the day of onset is also associated with an increase in deaths on that day. The relevance of these findings to possible mechanisms and prophylaxis is discussed.
Lancet. 1979 May 5;1(8123):982-3. No abstract available.
PMID:
87658
J Intern Med. 1991 Dec;230(6):479-85.
High coronary mortality in cold regions of Sweden.
Gyllerup S(1), Lanke J, Lindholm LH, Scherstén B.
Author information:
(1)Health Sciences Centre, Lund University, Dalby, Sweden.
The hypothesis that cold climate is associated with high coronary mortality in
Sweden is tested. Cold exposure was calculated in each of the 284 municipalities
of Sweden. There was a significant association between cold exposure and coronary
mortality in both sexes in all age groups. The strongest association was found in
men aged 40-64 years (coefficient of determination k = 0.39). The decile of men
aged 40-64 years who lived in the coldest municipalities had a 40% excess
mortality. A significant association was also found between cold exposure and
mortality from cerebrovascular diseases. We conclude that there is a strong
regional association between cold exposure and high coronary mortality.
DOI: 10.1111/j.1365-2796.1991.tb00478.x
PMID: 1748856 [Indexed for MEDLINE]
Author information:
(1)Husensjö Group Practice, Helsingborg, Sweden.
In many European countries there is a tendency towards higher coronary mortality
in the northern parts of the country. Furthermore the highest coronary mortality
rates are found in the colder parts of Europe. We studied the regional variation
in coronary mortality in the 284 Swedish municipalities during a ten-year period
and the relation to the cold exposure in each municipality during the same time
period.METHODS: Mortality rates for each municipality were acquired from the
death certificates and indirectly standardised against the country. Temperature
readings from measurements 5 times a day during daytime were used to form a cold
index. We also compensated for wind chill by using Siples wind chill index.
Multiple regression models were used. Second degree polynomials were used for the
explanatory variables.
RESULTS: There was a strong relation between the cold exposure in a municipality
and coronary mortality. The cold index alone could explain 39% of the regional
variation in coronary mortality. In a multiple regression model, cold index was
the strongest explanatory variable. The coronary mortality in the coldest decile
of the population was 40% higher than in the country as a whole.
CONCLUSIONS: There is a strong regional association between cold exposure and
coronary mortality in Sweden. However, in this type of study, it is not possible
to determine whether this association is a causal one or not.
Cold climate is an important factor in explaining regional differences in
coronary mortality even if serum cholesterol and other established risk factors
are taken into account.
Gyllerup S(1), Lanke J, Lindholm LH, Schersten B.
Author information:
(1)Health Sciences Centre, Lund University, Dalby Sweden.
Earlier studies have shown a strong regional association between cold climate and
coronary mortality in Sweden and that coronary mortality is more strongly
associated with cold climate than with other explanatory factors such as drinking
water hardness, socioeconomic factors, tobacco and sales of butter. To examine
the joint impact of these factors and to investigate regional differences in
serum cholesterol and their relation to cold climate and coronary mortality,
regression analyses were performed with 259 municipalities in Sweden as units.
Mortality from acute myocardial infarction in men aged 40-64 during 1975-1984 was
used as the dependent variable. A cold index was calculated, this index and the
above mentioned factors were used as explanatory variables. The main results
were: Cold index was the strongest factor when introduced into a multiple
regression model. Four other strong factors had to be used to obtain the same
explanatory strength as cold index did alone, and even when introduced as the
last factor, cold index increased the coefficient of determination substantially.
In a subsample of 37 municipalities, serum cholesterol was not significantly
associated with coronary mortality. However, there was a significant correlation
between cold index and serum cholesterol.
DOI: 10.1177/003693309303800604
PMID: 8146634 [Indexed for MEDLINE]
Am J Epidemiol. 2016 Oct 15;184(8):555-569. Epub 2016 Oct 6.
Pneumonia Hospitalization Risk in the Elderly Attributable to Cold and Hot
Temperatures in Hong Kong, China.
Qiu H, Sun S, Tang R, Chan KP, Tian L.
The growth of pathogens potentially relevant to respiratory tract infection may
be triggered by changes in ambient temperature. Few studies have examined the
association between ambient temperature and pneumonia incidence, and no studies
have focused on the susceptible elderly population. We aimed to examine the
short-term association between ambient temperature and geriatric pneumonia and to
assess the disease burden attributable to cold and hot temperatures in Hong Kong,
China. Daily time-series data on emergency hospital admissions for geriatric
pneumonia, mean temperature, relative humidity, and air pollution concentrations
between January 2005 and December 2012 were collected. Distributed-lag nonlinear
modeling integrated in quasi-Poisson regression was used to examine the
exposure-lag-response relationship between temperature and pneumonia
hospitalization. Measures of the risk attributable to nonoptimal temperature were
calculated to summarize the disease burden. Subgroup analyses were conducted to
examine the sex difference. We observed significant nonlinear and delayed
associations of both cold and hot temperatures with pneumonia in the elderly,
with cold temperatures having stronger effect estimates. Among the 10.7% of
temperature-related pneumonia hospitalizations, 8.7% and 2.0% were attributed to
cold and hot temperatures, respectively. Most of the temperature-related burden
for pneumonia hospitalizations in Hong Kong was attributable to cold
temperatures, and elderly men had greater susceptibility.
Influenza Other Respir Viruses. 2016 Jul;10(4):310-3. doi: 10.1111/irv.12369.
Epub 2016 May 17.
Cold, dry air is associated with influenza and pneumonia mortality in Auckland,
New Zealand.
Davis RE(1), Dougherty E(1), McArthur C(2), Huang QS(3), Baker MG(4).
Author information:
(1)Department of Environmental Sciences, University of Virginia, Charlottesville,
VA, USA.
(2)Auckland City Hospital, Auckland, New Zealand.
(3)Institute of Environmental Science and Research, Wellington, New Zealand.
(4)University of Otago-Wellington, Wellington, New Zealand.
The relationship between weather and influenza and pneumonia mortality was
examined retrospectively using daily data from 1980 to 2009 in Auckland, New
Zealand, a humid, subtropical location. Mortality events, defined when mortality
exceeded 0·95 standard deviation above the mean, followed periods of anomalously
cold air (ta.m. = -4·1, P < 0·01; tp.m. = -4·2, P < 0·01) and/or anomalously dry
air (ta.m. = -4·1, P < 0·01; tp.m. = -3·8, P < 0·01) by up to 19 days. These
results suggest that respiratory infection is enhanced during unusually cold
conditions and during conditions with unusually low humidity, even in a
subtropical location where humidity is typically high.
Environ Res. 2019 Feb;169:139-146. doi: 10.1016/j.envres.2018.10.031. Epub 2018
Oct 30.
Impacts of cold weather on emergency hospital admission in Texas, 2004-2013.
Chen TH(1), Du XL(1), Chan W(2), Zhang K(3).
Author information:
(1)Department of Epidemiology, Human Genetics and Environmental Sciences, School
of Public Health, The University of Texas Health Science Center at Houston,
Houston, TX 77030, USA.
(2)Department of Biostatistics and Data Science, School of Public Health, The
University of Texas Health Science Center at Houston, Houston, TX, USA.
(3)Department of Epidemiology, Human Genetics and Environmental Sciences, School
of Public Health, The University of Texas Health Science Center at Houston,
Houston, TX 77030, USA; Southwest Center for Occupational and Environmental
Health, School of Public Health, The University of Texas Health Science Center at
Houston, Houston, TX, USA. Electronic address: kai.zhang@uth.tmc.edu.
Cold weather has been identified as a major cause of weather-related deaths in
the U.S. Although the effects of cold weather on mortality has been investigated
extensively, studies on how cold weather affects hospital admissions are limited
particularly in the Southern United States. This study aimed to examine impacts
of cold weather on emergency hospital admissions (EHA) in 12 major Texas
metropolitan statistical areas (MSAs) for the 10-year period, 2004-2013. A
two-stage approach was employed to examine the associations between cold weather
and EHA. First, the cold effects on each MSA were estimated using distributed lag
non-linear models (DLNM). Then a random effects meta-analysis was applied to
estimate pooled effects across all 12 MSAs. Percent increase in risk and
corresponding 95% confidence intervals (CIs) were estimated as with a 1 °C (°C)
decrease in temperature below a MSA-specific threshold for cold effects.
Age-stratified and cause-specific EHA were modeled separately. The majority of
the 12 Texas MSAs were associated with an increased risk in EHA ranging from 0.1%
to 3.8% with a 1 ⁰C decrease below cold thresholds. The pooled effect estimate
was 1.6% (95% CI: 0.9%, 2.2%) increase in all-cause EHA risk with 1 ⁰C decrease
in temperature. Cold wave effects were also observed in most eastern and southern
Texas MSAs. Effects of cold on all-cause EHA were highest in the very elderly
(2.4%, 95% CI: 1.2%, 3.6%). Pooled estimates for cause-specific EHA association
were strongest in pneumonia (3.3%, 95% CI: 2.8%, 3.9%), followed by chronic
obstructive pulmonary disease (3.3%, 95% CI: 2.1%, 4.5%) and respiratory diseases
(2.8%, 95% CI: 1.9%, 3.7%). Cold weather generally increases EHA risk
significantly in Texas, especially in respiratory diseases, and cold effects
estimates increased by elderly population (aged over 75 years). Our findings
provide insight into better intervention strategy to reduce adverse health
effects of cold weather among targeted vulnerable populations.
Environ Res. 2014 Jul;132:334-41. doi: 10.1016/j.envres.2014.04.021. Epub 2014
May 14.
Impact of temperature on childhood pneumonia estimated from satellite remote
sensing.
Xu Z(1), Liu Y(2), Ma Z(2), Li S(3), Hu W(1), Tong S(4).
Author information:
(1)School of Public Health and Social Work & Institute of Health and Biomedical
Innovation, Queensland University of Technology, Brisbane, QLD, Australia.
(2)Rollins School of Public Health, Emory University, Atlanta, GA, United States.
(3)School of Public Health, Shanghai Jiaotong University School of Medicine,
Shanghai, China.
(4)School of Public Health and Social Work & Institute of Health and Biomedical
Innovation, Queensland University of Technology, Brisbane, QLD, Australia.
Electronic address: s.tong@qut.edu.au.
The effect of temperature on childhood pneumonia in subtropical regions is
largely unknown so far. This study examined the impact of temperature on
childhood pneumonia in Brisbane, Australia. A quasi-Poisson generalized linear
model combined with a distributed lag non-linear model was used to quantify the
main effect of temperature on emergency department visits (EDVs) for childhood
pneumonia in Brisbane from 2001 to 2010. The model residuals were checked to
identify added effects due to heat waves or cold spells. Both high and low
temperatures were associated with an increase in EDVs for childhood pneumonia.
Children aged 2-5 years, and female children were particularly vulnerable to the
impacts of heat and cold, and Indigenous children were sensitive to heat. Heat
waves and cold spells had significant added effects on childhood pneumonia, and
the magnitude of these effects increased with intensity and duration. There were
changes over time in both the main and added effects of temperature on childhood
pneumonia. Children, especially those female and Indigenous, should be
particularly protected from extreme temperatures. Future development of early
warning systems should take the change over time in the impact of temperature on
children’s health into account.
John F. McGowan, Ph.D. solves problems using mathematics and mathematical software, including developing gesture recognition for touch devices, video compression and speech recognition technologies. He has extensive experience developing software in C, C++, MATLAB, Python, Visual Basic and many other programming languages. He has been a Visiting Scholar at HP Labs developing computer vision algorithms and software for mobile devices. He has worked as a contractor at NASA Ames Research Center involved in the research and development of image and video processing algorithms and technology. He has published articles on the origin and evolution of life, the exploration of Mars (anticipating the discovery of methane on Mars), and cheap access to space. He has a Ph.D. in physics from the University of Illinois at Urbana-Champaign and a B.S. in physics from the California Institute of Technology (Caltech).
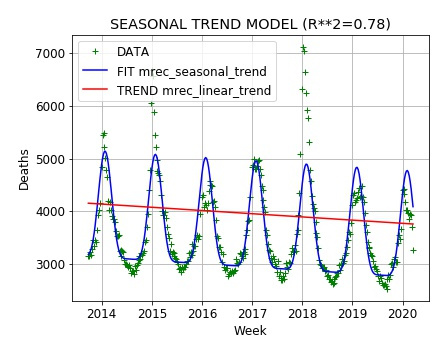
A key question about pneumonia and influenza is the role of sunlight and vitamin-D production on the incidence, severity, and mortality rates from the diseases. Pneumonia and influenza cases and deaths are seasonal, peaking in the winter when sunlight levels and temperatures are lower. The curve for pneumonia and influenza deaths is roughly sinusoidal, which would be expected from something connected to sunlight levels. This is not what one would naively expect from children spreading the disease during the school year; we would expect an abrupt step up in the fall when kids return to school and a step down in the spring when school closes.
The body needs sunlight to produce vitamin D. Sunlight, particularly the ultraviolet component, can damage or kill viruses and bacteria. These and other effects related to sunlight levels may play a role in the sinusoidal pattern of pneumonia and influenza deaths.
Roughly Sinusoidal Model of Pneumonia and Influenza Deaths
Vitamin D has long been recognized as essential to the skeletal system. Newer evidence suggests that it also plays a major role regulating the immune system, perhaps including immune responses to viral infection. Interventional and observational epidemiological studies provide evidence that vitamin D deficiency may confer increased risk of influenza and respiratory tract infection. Vitamin D deficiency is also prevalent among patients with HIV infection. Cell culture experiments support the thesis that vitamin D has direct anti-viral effects particularly against enveloped viruses. Though vitamin D’s anti-viral mechanism has not been fully established, it may be linked to vitamin D’s ability to up-regulate the anti-microbial peptides LL-37 and human beta defensin 2. Additional studies are necessary to fully elucidate the efficacy and mechanism of vitamin D as an anti-viral agent.
It
is now clear that vitamin D has important roles in addition to its
classic effects on calcium and bone homeostasis. As the vitamin D
receptor is expressed on immune cells (B cells, T cells and antigen
presenting cells) and these immunologic cells are all are capable of
synthesizing the active vitamin D metabolite, vitamin D has the
capability of acting in an autocrine manner in a local immunologic
milieu. Vitamin D can modulate the innate and adaptive immune responses.
Deficiency in vitamin D is associated with increased autoimmunity as
well as an increased susceptibility to infection. As immune cells in
autoimmune diseases are responsive to the ameliorative effects of
vitamin D, the beneficial effects of supplementing vitamin D deficient
individuals with autoimmune disease may extend beyond the effects on
bone and calcium homeostasis.
DisclaimerThe publisher’s final edited version of this article is available at J Investig MedSee other articles in PMC that cite the published article.Go to:
Over the past decade, interest has grown in the role of vitamin D in many nonskeletal medical conditions, including respiratory infection. Emerging evidence indicates that vitamin D-mediated innate immunity, particularly through enhanced expression of the human cathelicidin antimicrobial peptide (hCAP-18), is important in host defenses against respiratory tract pathogens. Observational studies suggest that vitamin D deficiency increases risk of respiratory infections. This increased risk may contribute to incident wheezing illness in children and adults and cause asthma exacerbations. Although unproven, the increased risk of specific respiratory infections in susceptible hosts may contribute to some cases of incident asthma. Vitamin D also modulates regulatory T-cell function and interleukin-10 production, which may increase the therapeutic response to glucocorticoids in steroid-resistant asthma. Future laboratory, epidemiologic, and randomized interventional studies are needed to better understand vitamin D’s effects on respiratory infection and asthma.PMID: 19063829 DOI: 10.1007/s11882-009-0012-7
The scientific and scholarly articles listed above include links to many other scholarly and scientific articles on the role of Vitamin D in respiratory illnesses.
John F. McGowan, Ph.D. solves problems using mathematics and mathematical software, including developing gesture recognition for touch devices, video compression and speech recognition technologies. He has extensive experience developing software in C, C++, MATLAB, Python, Visual Basic and many other programming languages. He has been a Visiting Scholar at HP Labs developing computer vision algorithms and software for mobile devices. He has worked as a contractor at NASA Ames Research Center involved in the research and development of image and video processing algorithms and technology. He has published articles on the origin and evolution of life, the exploration of Mars (anticipating the discovery of methane on Mars), and cheap access to space. He has a Ph.D. in physics from the University of Illinois at Urbana-Champaign and a B.S. in physics from the California Institute of Technology (Caltech).
A key question about the coronavirus COVID-19 pandemic and pneumonia and influenza deaths in general is the role of air pollution in the disease and deaths. Wuhan, China — the presumed source of the outbreak — had high levels of pollution resulting in mass protests in July of 2019 and the hard hit Lombardy region of Italy had some of the highest air pollution levels in Europe. There are many kinds of air pollution and how they interact with the lungs, immune system, and various infections is unclear. There is a long body of research that air pollution increases the risk and severity of pneumonia.
I have listed several popular and scientific articles on air pollution and the coronavirus or pneumonia in general below. I also included several articles from 2019 on the protests in Wuhan at the end.
Keep in mind when medical scientists and the press say “linked” or “associated” this usually mean a statistical correlation has been found. Correlation (even perfect correlation) does not prove causation.
This New York Times article is about the Harvard research listed below in the Scientific Articles section.
Conclusions: A small increase in long-term exposure to PM2.5 leads to a large increase in COVID-19 death rate, with the magnitude of increase 20 times that observed for PM2.5 and all-cause mortality. The study results underscore the importance of continuing to enforce existing air pollution regulations to protect human health both during and after the COVID-19 crisis. The data and code are publicly available.
“Does air pollution make you more susceptible to coronavirus? California won’t like the answer” by Tony Barboza, March 21, 2020, LA Times
A relatively recent study at McMaster University in Canada linking air pollution to pneumonia.
Scientific Articles
Exposure to air pollution and COVID-19 mortality in the United States (Updated April 5, 2020)
Xiao Wu MS, Rachel C. Nethery PhD, M. Benjamin Sabath MA, Danielle Braun PhD, Francesca Dominici PhD All authors are part of the Department of Biostatistics, Harvard T.H. Chan School of Public Health, Boston, MA, 02115, USA
Lead authors: Xiao Wu and Rachel C. Nethery Corresponding and senior author: Francesca Dominici, PhD
Conclusions: A small increase in long-term exposure to PM2.5 leads to a large increase in COVID-19 death rate, with the magnitude of increase 20 times that observed for PM2.5 and all-cause mortality. The study results underscore the importance of continuing to enforce existing air pollution regulations to protect human health both during and after the COVID-19 crisis. The data and code are publicly available.
Conclusions: Increased rates of culture-negative pneumonia and influenza were associated with increased PM2.5 concentrations during the previous week, which persisted despite reductions in PM2.5 from air quality policies and economic changes. Though unexplained, this temporal variation may reflect altered toxicity of different PM2.5 mixtures or increased pathogen virulence.
John F. McGowan, Ph.D. solves problems using mathematics and mathematical software, including developing gesture recognition for touch devices, video compression and speech recognition technologies. He has extensive experience developing software in C, C++, MATLAB, Python, Visual Basic and many other programming languages. He has been a Visiting Scholar at HP Labs developing computer vision algorithms and software for mobile devices. He has worked as a contractor at NASA Ames Research Center involved in the research and development of image and video processing algorithms and technology. He has published articles on the origin and evolution of life, the exploration of Mars (anticipating the discovery of methane on Mars), and cheap access to space. He has a Ph.D. in physics from the University of Illinois at Urbana-Champaign and a B.S. in physics from the California Institute of Technology (Caltech).
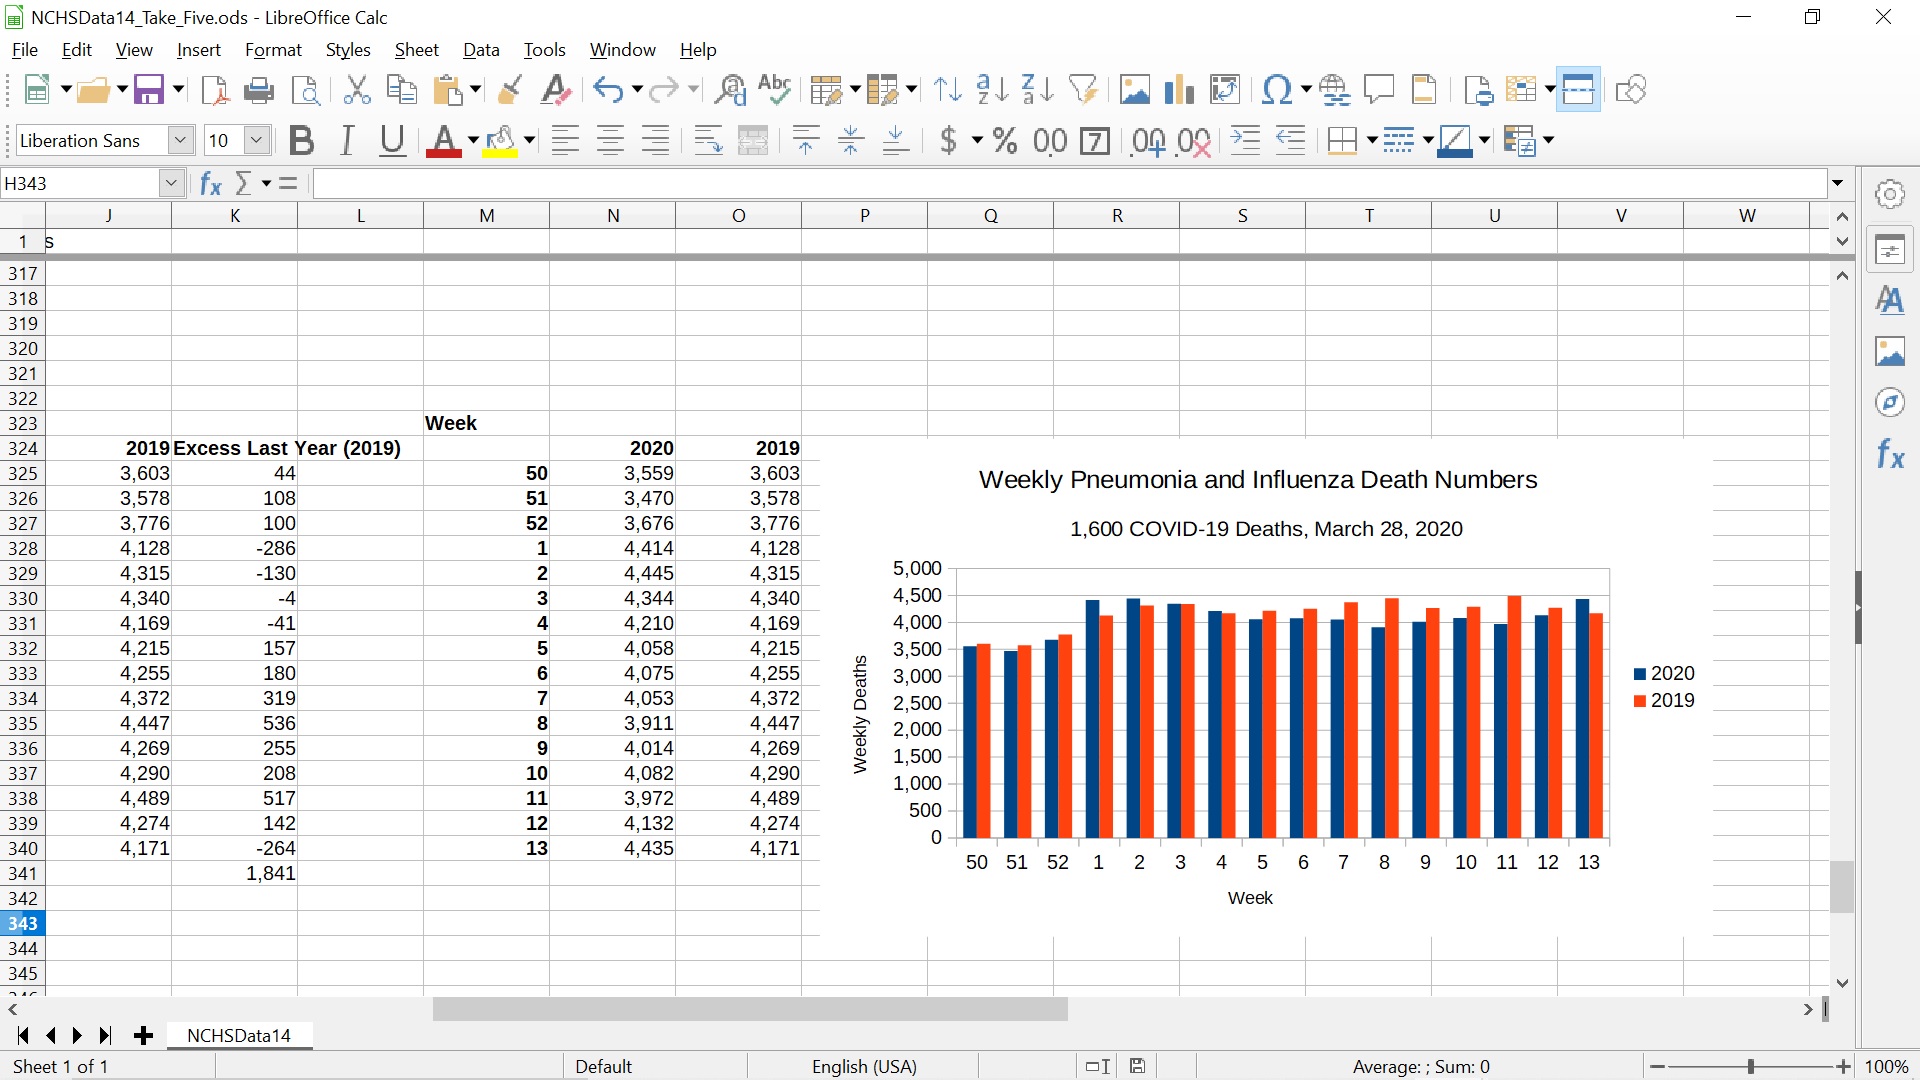
Weekly Pneumonia and Influenza Death Numbers for 2020 and 2019 Compared
The updated plot is from a LibreOffice spreadsheet which can be downloaded at the link below. LibreOffice is a free, open-source alternative to Microsoft Office. It is available for Microsoft Windows, Mac OS X, and most flavors of Unix. It can be downloaded here.
I made a mistake copying the column of pneumonia and influenza deaths from early 2019 (weeks 1-13 of 2019 and weeks 50-52 of 2020) with LibreOffice Calc (the spreadsheet). The spreadsheet copied the macros in the cells instead of the number values. These macros were then applied to the columns to the left of the copied column, giving incorrect values that exaggerated the excess of deaths in comparable weeks last year (2019).
The actual excess is 1,841 more deaths in 2019, not about 6,000.
I was using the spreadsheet to make the results more accessible to a general audience. The copying error was consistent with the results from the more in-depth Python data analysis. In retrospect I should have checked the spreadsheet numbers more carefully.
Discussion
This does not change the conclusion that there is no sign of COVID-19 in the numbers until March 14, 2020 and a weak rise consistent with normal fluctuations in the weekly numbers in the final two weeks (March 14-28, 2020, weeks 12 and 13). It does reduce the size of the discrepancy between the two years. It remains possible that all the about 1,600 COVID-19 deaths reported as of March 28, 2020 could be conventional pneumonia and influenza deaths labeled as COVID-19 due to false positive RT-PCR tests and other misdiagnoses.
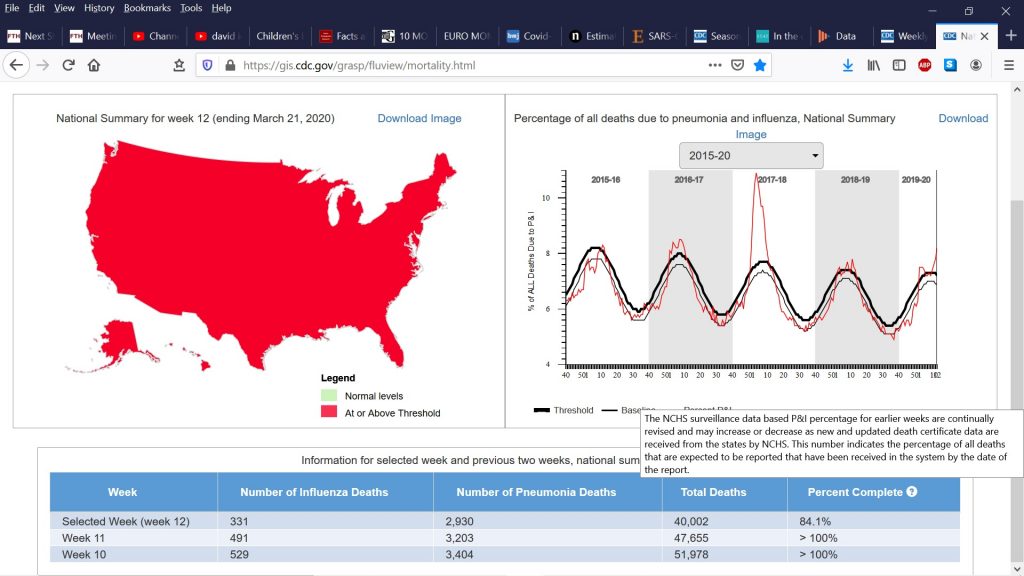
As I have discussed, there are strong reasons to doubt the CDC numbers. The most egregious I have found so far is the remarkable difference between the about 55,000 deaths from “influenza and pneumonia” in the leading causes of death tables (Table B, Page Six) and the about 188,000 deaths from “pneumonia and influenza” in the NCHSData14.csv file and other NCHSData<Week Number>.csv files.
An educated guess is that the 55,000 deaths from “influenza and pneumonia” is the output of a model the CDC uses to estimate the number of deaths directly or indirectly caused by “influenza viruses.” In the weekly pneumonia and influenza death numbers, the vast majority of deaths are listed as pneumonia and not the separate “influenza” category. Thus about 130,000 deaths appear to have been assigned to other categories in the final deaths for 2017 report, possibly “chronic lower respiratory diseases” which is the fourth (4th) leading cause of death. This is however a theory and CDC should carefully clarify what they are doing.
Accordingly, it is difficult to know what pre-processing or modeling/estimation may have been applied to the weekly pneumonia and influenza death numbers, although the commentary on the CDC web site implies these numbers are counts of death certificates and the causes of death on death certificates reported to the CDC by state and local authorities.
I am looking through the NCHSData<Week Number>.csv files to see how complete they may actually be. The FluView web page contains a table that seems to imply that all weeks except the very last week in the file are complete or almost complete. They use the label “> 100%” where > is presumably “greater than”. Of course, 100 percent usually means complete.
CDC “Percent Complete” Table (Misleading language at best)
There are many possible reasons for COVID-19 deaths not showing up in the weekly pneumonia and influenza death numbers before March 14, 2020 despite the Chinese coverup in December and early January, the US testing fiasco, the 430,000 visitors to the United States from China since the coronavirus surfaced, and the many asymptomatic carriers now being detected. These different possible reasons have different, even opposite in some cases, implications for public health policy.
Possible reasons include:
Despite the many problems above, the public health authorities have been remarkably successful in identifying nearly all COVID-19 deaths up to March 14, 2020. This seems too good to be true, but cannot be excluded.
The infection fatality rate (aka actual mortality rate) of the COVID-19 coronavirus is much less than early numbers such as 3.4 percent from the World Health Organization (WHO) or the 0.9-1 percent used by various authorities. Iceland, South Korean, Denmark and German data suggest about 0.5 percent mortality rate – which still could be higher than real rate.
Many COVID-19 deaths are due to aggressive treatment of the disease, e.g. intubation, rather than the disease alone.
The weekly pneumonia and influenza death numbers are substantially incomplete, due to normal delays or due to unusual delays associated with the crisis.
There has been a compensating drop in non-COVID pneumonia and influenza deaths due to shelter-in-place and taking it easy. Elderly and susceptible persons may have taken precautions in January and February due to the publicity, even before the shutdown in mid March.
Something else
Some combination of some or all of the above!
Conclusion
There is a remarkable lack of key measurements in the current coronavirus COVID-19 pandemic. These include the actual mortality rate (aka infection fatality rate) broken down by age, sex, race, pre-existing medical conditions, ambient temperature, sunlight levels, pollution levels, and other risk factors. The false positive and false negative rates of the tests for the disease, both the tests for an active infection such as the RT-PCR tests and tests for past infection such as the antibody tests. The methods and rates of transmission for the disease. Aerosol transmission probably occurs at least at a low level and is virtually unstoppable.
It is important to collect this data and measure these key parameters as quickly as possible in an open, “transparent” manner with multiple independent teams, not all funded or controlled by the CDC, as soon as possible to make good decisions based on knowledge and data, rather than fear, ignorance, and the primal fight or flight response.
(C) 2020 by John F. McGowan, Ph.D.
About Me
John F. McGowan, Ph.D. solves problems using mathematics and mathematical software, including developing gesture recognition for touch devices, video compression and speech recognition technologies. He has extensive experience developing software in C, C++, MATLAB, Python, Visual Basic and many other programming languages. He has been a Visiting Scholar at HP Labs developing computer vision algorithms and software for mobile devices. He has worked as a contractor at NASA Ames Research Center involved in the research and development of image and video processing algorithms and technology. He has published articles on the origin and evolution of life, the exploration of Mars (anticipating the discovery of methane on Mars), and cheap access to space. He has a Ph.D. in physics from the University of Illinois at Urbana-Champaign and a B.S. in physics from the California Institute of Technology (Caltech).
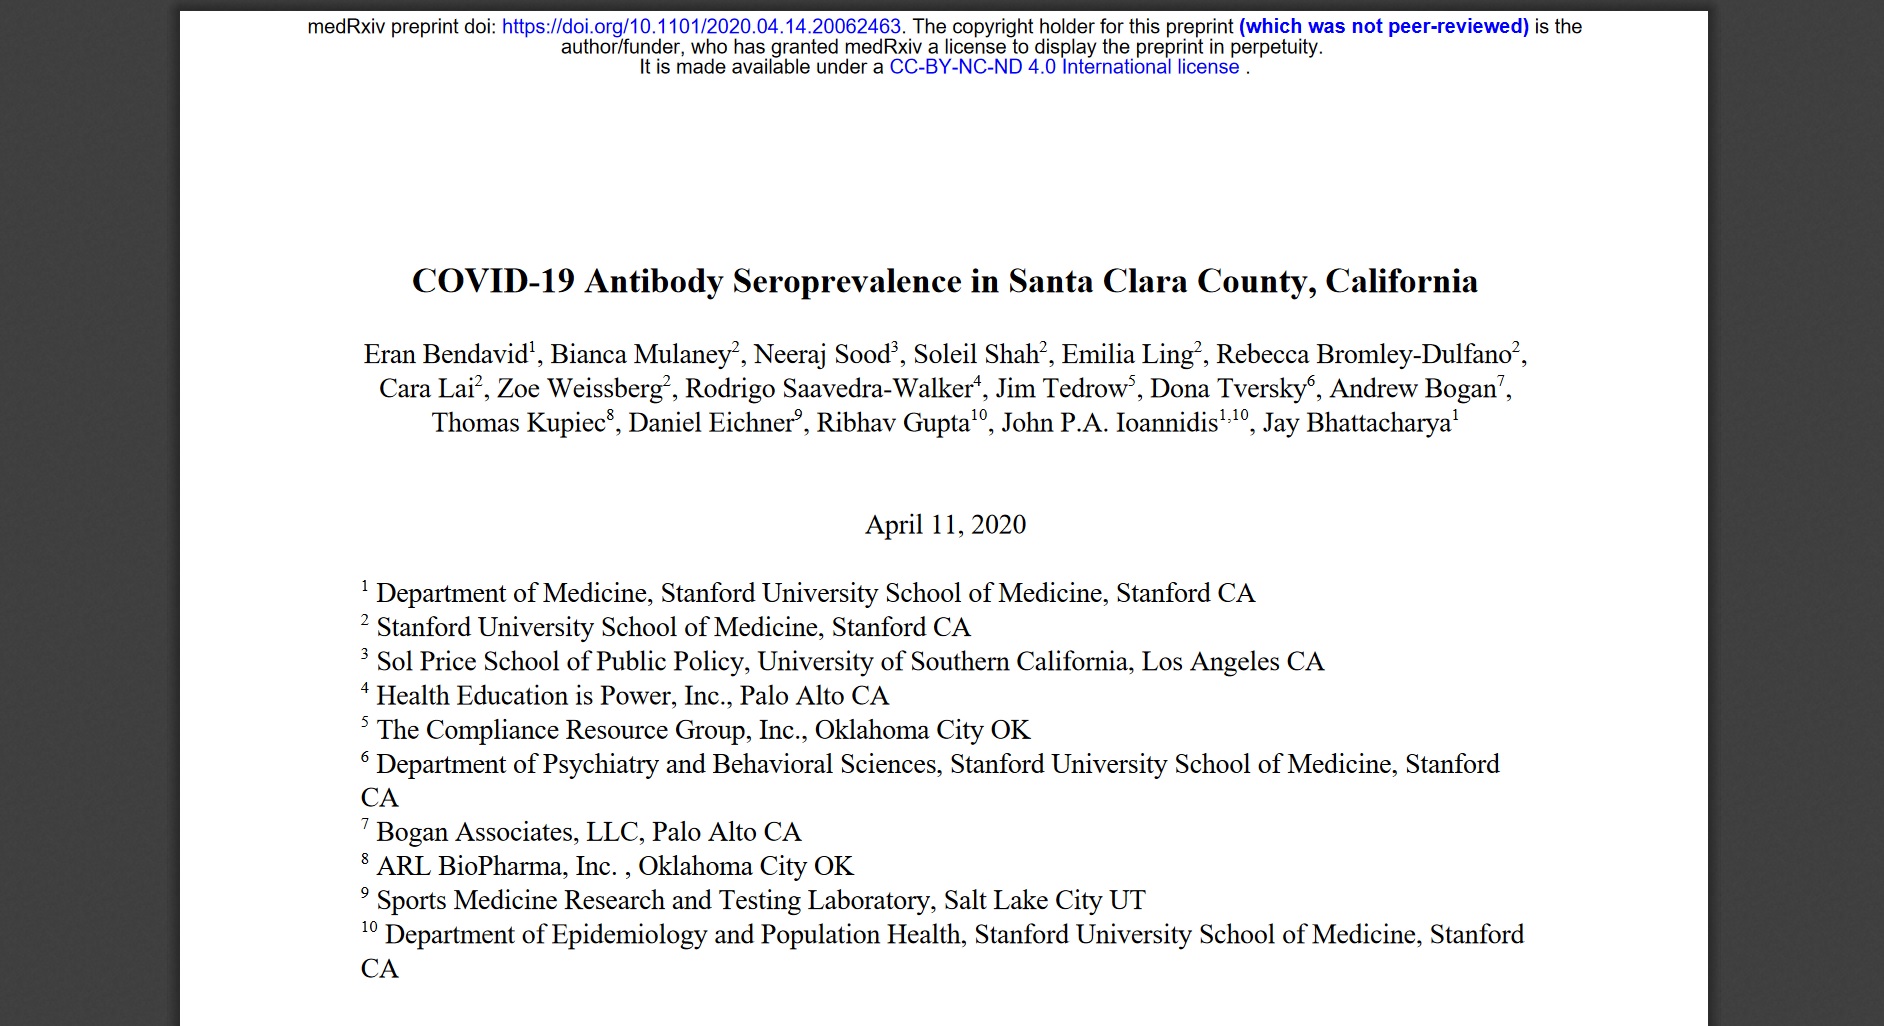
In coverage of the coronavirus COVID-19 pandemic, one often sees a value for the infection fatality rate (also known as the actual mortality rate, which is different from the “case fatality rate”) of 0.1 percent, meaning one in 1000 people infected by the “flu” dies. Infected includes people who are asymptomatic, have mild cases — anyone who is actually infected even if never detected. It is often explicitly or implicitly argued that if the infection fatality rate of COVID-19 is only 0.1 percent as suggested by a recent study by Stanford researchers (https://www.medrxiv.org/content/10.1101/2020.04.14.20062463v1.full.pdf) we can relax and go back to work. Unfortunately, it is probably not that simple.
We can use our prevalence estimates to approximate the infection fatality rate from COVID-19 in Santa Clara County. As of April 10, 2020, 50 people have died of COVID-19 in the County, with an average increase of 6% daily in the number of deaths. If our estimates of48,000-81,000 infections represent the cumulative total on April 1, and we project deaths to April 22 (a 3 week lag from time of infection to death22), we estimate about 100 deaths in the county. A hundred deaths out of 48,000-81,000 infections corresponds to an infection fatality rate of 0.12-0.2%. If antibodies take longer than 3 days to appear, if the average duration from case identification to death is less than 3 weeks, or if the epidemic wave has peaked and growth in deaths is less than 6% daily, then the infection fatality rate would be lower. These straightforward estimations of infection fatality rate fail to account for age structure and changing treatment approaches to COVID-19. Nevertheless,our prevalence estimates can be used to update existing fatality rates given the large upwards revision of under-ascertainment
COVID-19 Antibody Seroprevalence in Santa Clara County, California by Bendavid et al
It is thought the vast majority of adults get at least two symptomatic “colds” or “flus” in common usage (The CDC claims adults get 2-3 “common colds” per year and children more on their web site which matches common experience.). These are caused by a wide variety of viruses and bacteria and sometimes chemical toxins. These include the rhinovirus, various coronaviruses other that the “novel” SARS-COV-2 coronavirus, and many others including a category of viruses known as “influenza” or “influenza viruses”.
With a total US population of about 330 million, we can estimate at least 660 million individual cases and separate infections of these “cold” or “flu” organisms (either viruses or bacteria) each year. This gives a naive effective infection fatality rate averaged over the population and different diseases of:
188,000 divided by 660 million is: 0.028 percent (0.00028484848484848485)
55,000 divided by 660 million is: 0.008 percent (0.00008333333333)
This is of course much less than 0.1 percent (one in 1000).
What gives?
In common English usage, the terms “cold” and “flu” are often used interchangeably. The use of the terms “flu” and “influenza” to describe respiratory illnesses that vary in incidence seasonally predates the discovery of the influenza viruses, a category of viruses that can cause these symptoms. Influenza is Italian, from the Latin “influentia,” for “influence,” referring to the baleful influence of the stars that the ancients blamed for the disease.
The CDC hopelessly blurs the distinctions, if any, between “common cold”, “cold”, “flu”, “influenza”, “influenza like illness,” “influenza associated,” “pneumonia,” and other terms in its promotional and “scientific” materials.
Influenza as in the influenza viruses is rarely listed as a cause of death on death certificates. The weekly “pneumonia and influenza” death numbers from the National Center for Health Statistics (NCHS) only list about 8,000 deaths from influenza in 2017. The CDC cites several different reasons for claiming there is massive underdiagnosis and underreporting of influenza (THE VIRUS) deaths, dating back to at least 2005 and persisting despite the CDC’s extensive educational efforts.
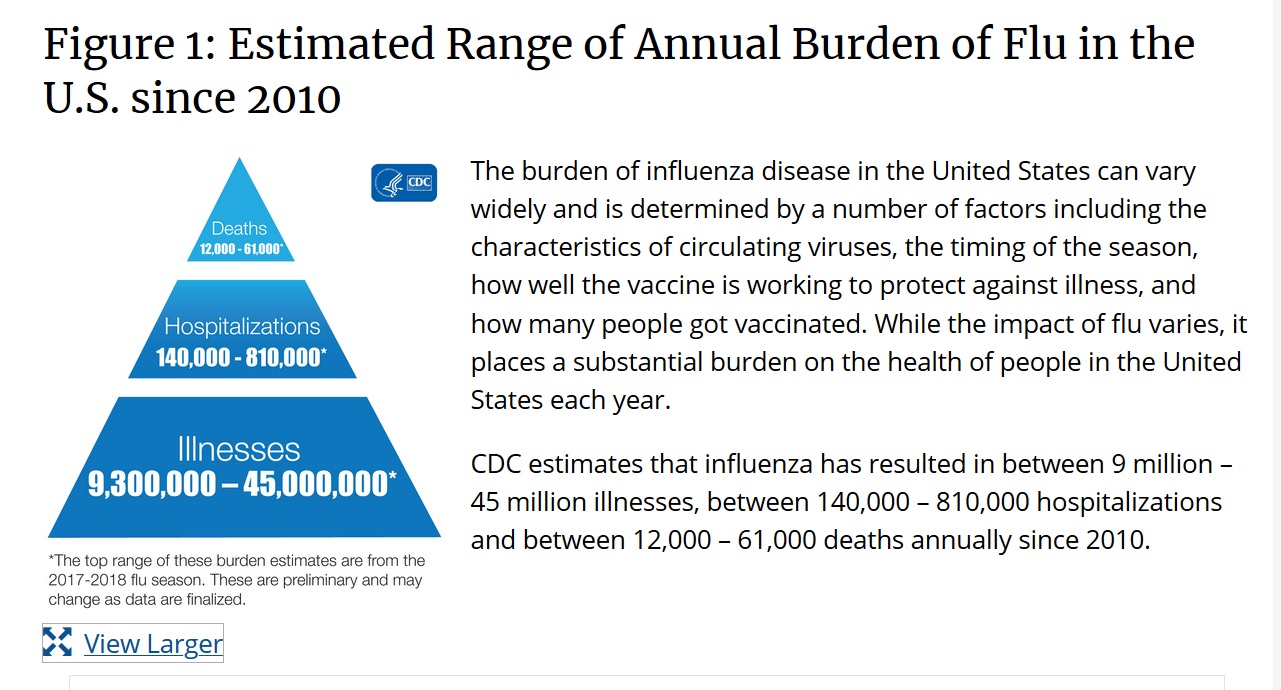
The CDC uses a mysterious model to estimate about 55,000 annual deaths from influenza (THE VIRUS). Presumably the number of deaths from “influenza and pneumonia” in the leading causes of death is this number or something closely related — but this is not clear. Incidentally, in this age of the Internet and pervasive computing, the CDC could publish the actual source code for their model in a free open-source language such as Python on their web site for all to see and review.
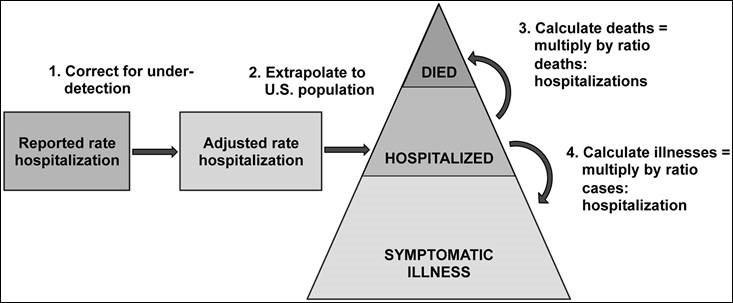
CDC Graphic About Influenza Model (There is a HUGE correction for under-detection)
Part of this model is an estimate of how many “colds” are caused by an influenza virus. Presumably this number is about 55 million to get the widely quoted 0.1 percent (one in 1000) infection fatality rate for influenza. This is an example of the CDC’s estimates from https://www.cdc.gov/flu/about/burden/index.html:
Thus, the CDC estimates about 55 million of the annual over 660 million “cold” cases in the United States is caused by “influenza disease” or “influenza” or “flu,” presumably meaning cases caused by influenza viruses. This is probably less than ten percent of all “colds.” The CDC also estimates about 55,000 deaths from influenza viruses. This presumably gives the about 0.1 percent (one in 1000) number widely quoted in the media.
Everyone should understand that a 0.1 percent (one in 1000) infection fatality rate is much higher than the effective infection fatality rate of all the diseases that cause deaths attributed to “pneumonia and influenza” and that also typically cause two “common colds” or “flus” in healthy adults each year.
Even accepting the CDC’s estimates of the prevalence of illness due to influenza viruses (THE VIRUS), less than ten percent of all “common colds,” if the coronavirus COVID-19 spreads more easily than the influenza viruses, it may be able to kill more people than the influenza viruses with the same infection fatality rate (e.g. one in 1000, 0.1 percent). We also need to know how the SARS-COV-2 coronavirus spreads and how quickly.
If everyone in the United States were infected with the COVID-19 coronavirus, a 0.1 percent infection fatality rate (one in 1,000) would probably mean somewhat less than 330,000 additional deaths on top of the roughly 188,000 deaths from “pneumonia and influenza” (or is it 55,000 from “influenza and pneumonia”). There would be some overlap between COVID-19 coronavirus deaths and deaths of susceptible, mostly elderly persons that would have happened anyway due to conventional non-COVID diseases including the influenza viruses.
Conclusion
There is a remarkable lack of key measurements in the current coronavirus COVID-19 pandemic. These include the actual mortality rate (aka infection fatality rate) broken down by age, sex, race, pre-existing medical conditions, ambient temperature, sunlight levels, pollution levels, and other risk factors. The false positive and false negative rates of the tests for the disease, both the tests for an active infection such as the RT-PCR tests and tests for past infection such as the antibody tests. The methods and rates of transmission for the disease. Aerosol transmission probably occurs at least at a low level and is virtually unstoppable.
The CDC and the National Security bioweapons defense programs should have been set up to quickly and efficiently collect these key data and parameters as soon as a possible outbreak or attack was detected, independent of warnings and information provided by a potential adversary such as China or from the World Health Organization (WHO).
The confusing language and numbers on pneumonia and influenza on the CDC web site and in various official reports and documents seem to be primarily for marketing the flu vaccines rather than enabling informed decisions by patients and doctors or supporting external scientific research into the influenza viruses or other diseases.
(C) 2020 by John F. McGowan, Ph.D.
About Me
John F. McGowan, Ph.D. solves problems using mathematics and mathematical software, including developing gesture recognition for touch devices, video compression and speech recognition technologies. He has extensive experience developing software in C, C++, MATLAB, Python, Visual Basic and many other programming languages. He has been a Visiting Scholar at HP Labs developing computer vision algorithms and software for mobile devices. He has worked as a contractor at NASA Ames Research Center involved in the research and development of image and video processing algorithms and technology. He has published articles on the origin and evolution of life, the exploration of Mars (anticipating the discovery of methane on Mars), and cheap access to space. He has a Ph.D. in physics from the University of Illinois at Urbana-Champaign and a B.S. in physics from the California Institute of Technology (Caltech).
Addressing COVID-19 is a pressing health and social concern. To date, many epidemic projections and policies addressing COVID-19 have been designed without seroprevalence data to inform epidemic parameters. We measured the seroprevalence of antibodies to SARS-CoV-2 in Santa Clara County.
Methods
On 4/3-4/4, 2020, we tested county residents for antibodies to SARS-CoV-2 using a lateral flow immunoassay. Participants were recruited using Facebook ads targeting a representative sample of the county by demographic and geographic characteristics. We report the prevalence of antibodies to SARS-CoV-2 in a sample of 3,330 people, adjusting for zip code, sex, and race/ethnicity. We also adjust for test performance characteristics using 3 different estimates: (i) the test manufacturer’s data, (ii) a sample of 37 positive and 30 negative controls tested at Stanford, and (iii) a combination of both.
Results The unadjusted prevalence of antibodies to SARS-CoV-2 in Santa Clara County was 1.5% (exact binomial 95CI 1.11-1.97%), and the population-weighted prevalence was 2.81% (95CI 2.24-3.37%). Under the three scenarios for test performance characteristics, the population prevalence of COVID-19 in Santa Clara ranged from 2.49% (95CI 1.80-3.17%) to 4.16% (2.58-5.70%). These prevalence estimates represent a range between 48,000 and 81,000 people infected in Santa Clara County by early April, 50-85-fold more than the number of confirmed cases.
Conclusions
The population prevalence of SARS-CoV-2 antibodies in Santa Clara County implies that the infection is much more widespread than indicated by the number of confirmed cases. Population prevalence estimates can now be used to calibrate epidemic and mortality projections.
This is of course a preliminary study.
It is worth noting that officially only about sixty (60) people have died of Coronavirus COVID-19 in Santa Clara County CA, a county of almost two million residents with very close ties to China. If true the preliminary study results would indicate that the actual mortality rate in Santa Clara County is well below one percent of those infected (60/48,000 is 0.125 percent for example).
(C) 2020 by John F. McGowan, Ph.D.
About Me
John F. McGowan, Ph.D. solves problems using mathematics and mathematical software, including developing gesture recognition for touch devices, video compression and speech recognition technologies. He has extensive experience developing software in C, C++, MATLAB, Python, Visual Basic and many other programming languages. He has been a Visiting Scholar at HP Labs developing computer vision algorithms and software for mobile devices. He has worked as a contractor at NASA Ames Research Center involved in the research and development of image and video processing algorithms and technology. He has published articles on the origin and evolution of life, the exploration of Mars (anticipating the discovery of methane on Mars), and cheap access to space. He has a Ph.D. in physics from the University of Illinois at Urbana-Champaign and a B.S. in physics from the California Institute of Technology (Caltech).
I have added a video showing the CDC Pneumonia and Influenza Weekly Deaths web site as it is (was) on April 15, 2020. In this video I show the different web site sections I have discussed, download theNCHSData14.csvweekly deaths data file, go through the analysis briefly in a spreadsheet, and show the difference between the numbers in 2017 in the file and the Final Death (Leading Causes of Deaths) numbers in 2017.
The weekly pneumonia and influenza deaths data shows fewer deaths in weeks one through thirteen, the latest week in the file ending March 28, 2020, than in the comparable weeks in 2019 — last year. This despite the COVID-19 pandemic, lack of testing in the United States, asymptomatic carriers, and other issues.
The weekly pneumonia and influenza deaths data also show about 188,000 deaths from pneumonia and influenza in 2017, over THREE TIMES the about 55,000 deaths listed as “influenza and pneumonia” in the 2017 leading causes of death.
NOTE: If you are concerned about these odd numbers, please consider sharing the original post and/or this one by e-mail, a link on your web site or blog, or other methods in addition to advertising-funded and other big company social media. My original post of this on Hacker News soared for a few hours and then was flagged and shut down, for example. I have also encountered social media mobs that engage in name calling and do not address the substantive issues.
CDC Web Site Video
It seems likely to me that the CDC web site will change in response to questions about the confusing numbers and language. Hopefully, the CDC will clarify the language and numbers in an open, “transparent,” and genuinely honest way that survives critical scrutiny. Especially given the life and death situation.
John F. McGowan, Ph.D. solves problems using mathematics and mathematical software, including developing gesture recognition for touch devices, video compression and speech recognition technologies. He has extensive experience developing software in C, C++, MATLAB, Python, Visual Basic and many other programming languages. He has been a Visiting Scholar at HP Labs developing computer vision algorithms and software for mobile devices. He has worked as a contractor at NASA Ames Research Center involved in the research and development of image and video processing algorithms and technology. He has published articles on the origin and evolution of life, the exploration of Mars (anticipating the discovery of methane on Mars), and cheap access to space. He has a Ph.D. in physics from the University of Illinois at Urbana-Champaign and a B.S. in physics from the California Institute of Technology (Caltech).
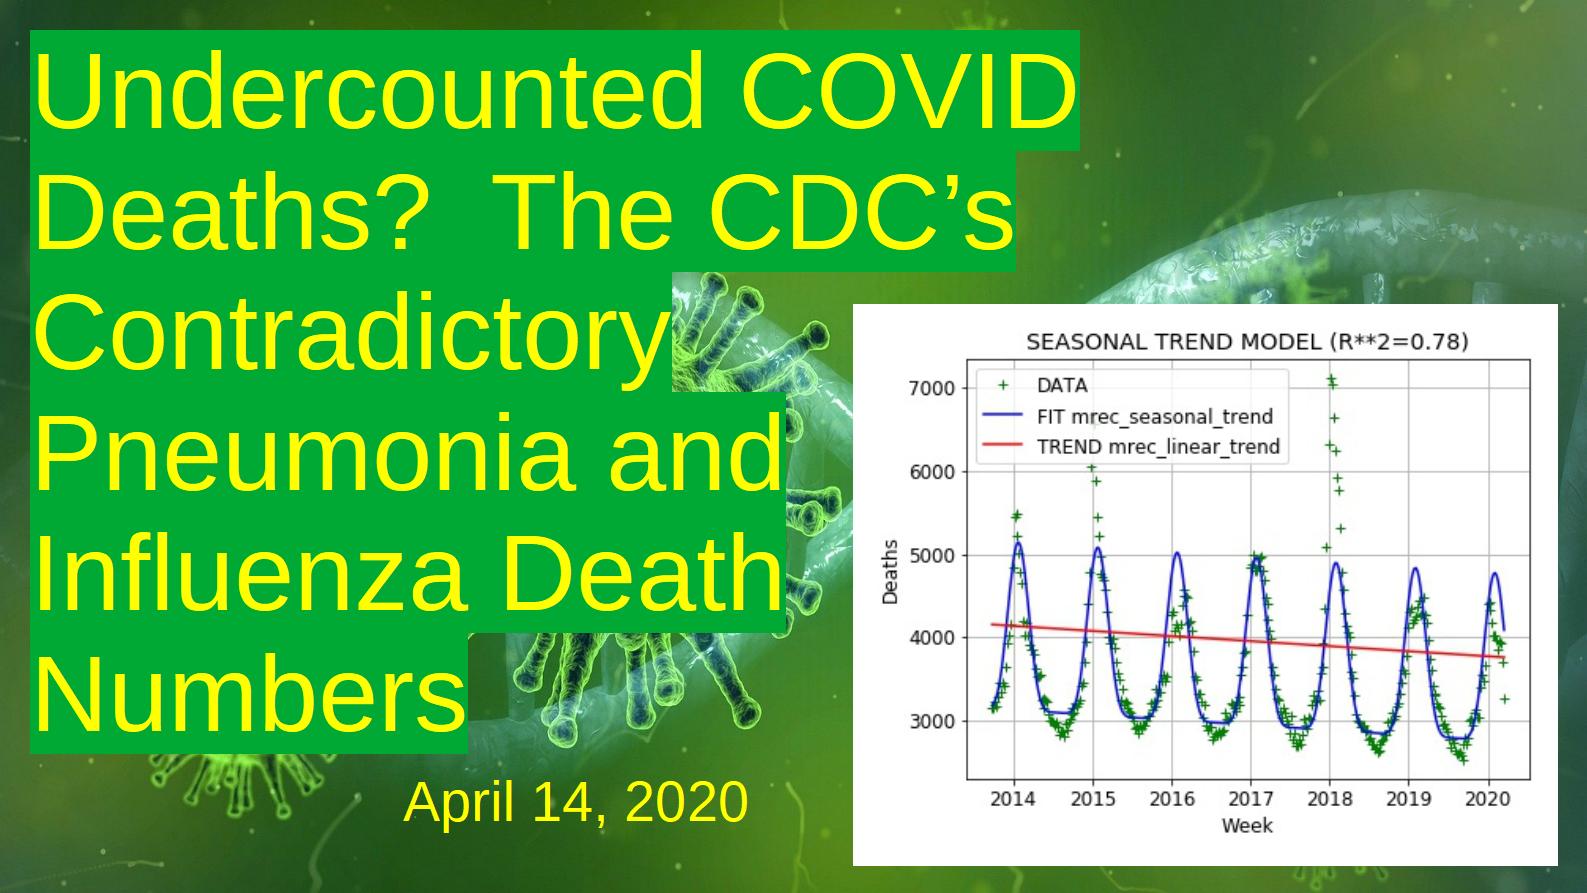
This presentation discusses the CDC’s contradictory weekly and annual pneumonia and influenza deaths. Even the latest (as of April 14, 2020) weekly death numbers show fewer deaths in 2020 than comparable weeks last year (2019) despite the Coronavirus COVID-19 pandemic. Given asymptomatic carriers and inadequate testing in the United States, one would expect a surge in reported pneumonia and influenza deaths.
Remarkably summing the weekly pnemonia and influenza deaths gives about 180,000 annual deaths from pneumonia and influenza, over THREE TIMES the widely cited 55,000 “influenza and pneumonia” deaths from the annual leading causes of death report.
These numbers raise troubling questions about the CDC and its collection, analysis and reporting of pneumonia and influenza numbers. The low number of weekly deaths compared to last year could indicate that there may be many uncounted COVID deaths, or that the disease is much less deadly than popular reports, or several other possibilities with substantially different public health implications. The numbers need to be clarified as soon as possible.
Both a video version and a written PDF version are provided below. The written version is generally faster to read and includes references and some additional technical details.
NOTE: If you are concerned about these odd numbers, please consider sharing this post by e-mail, a link on your web site or blog, or other methods in addition to advertising-funded and other big company social media. My post of this on Hacker News soared for a few hours and then was flagged and shut down, for example. I have also encountered social media mobs that engage in name calling and do not address the substantive issues.
Video Presentation
Uncounted COVID Deaths? The CDC’s Contradictory Pneumonia and Influenza Death Numbers
John F. McGowan, Ph.D. solves problems using mathematics and mathematical software, including developing gesture recognition for touch devices, video compression and speech recognition technologies. He has extensive experience developing software in C, C++, MATLAB, Python, Visual Basic and many other programming languages. He has been a Visiting Scholar at HP Labs developing computer vision algorithms and software for mobile devices. He has worked as a contractor at NASA Ames Research Center involved in the research and development of image and video processing algorithms and technology. He has published articles on the origin and evolution of life, the exploration of Mars (anticipating the discovery of methane on Mars), and cheap access to space. He has a Ph.D. in physics from the University of Illinois at Urbana-Champaign and a B.S. in physics from the California Institute of Technology (Caltech).
NOTE: This is an updated version of my presentation “The Myth of Falsifiability.” I have added a few comments on the application of falsifiability and falsifiability metrics to models of the COVID-19 pandemic. The main focus is on the safety and effectiveness of drugs and medical treatments and financial models of investments, but the relevance to COVID-19 models should be obvious.A video version of this presentation is available at https://youtu.be/6y6_6x_kmlY
The article starts with a discussion of the myth of falsifiability, a commonly cited doctrine often used to exclude certain points of view and evidence from consideration as “not scientific”. It discusses the glaring problems with the popular versions of this doctrine and the lack of a rigorous quantitative formulation of a more nuanced concept of falsifiability as originally proposed, but not developed, by the philosopher Karl Popper. The article concludes with a brief accessible presentation of our work on a rigorous quantitative falsifiability metric useful in practical science and engineering.
The scientific doctrine of falsifiability is key in practical problems such as confirming the accuracy and reliability of epidemiological models of the COVID-19 pandemic, the safety and effectiveness of pharmaceuticals and the safety and the reliability of financial models. How confident can we be of unprecedented world-changing policies ostensibly based on a plethora of conflicting models of the COVID-19 pandemic combined with highly incomplete and rapidly changing data?
How confident can we be that FDA approved drugs are safe, let alone effective? How confident can we be of AAA ratings for securities based on mathematical models?
In practice falsifiability is commonly cited to exclude certain points of view and evidence from consideration as “not scientific”.
The Encyclopedia Brittanica gives a typical example of the popular version of falsifiability:
Criterion of falsifiability, in the philosophy of science, a standard of evaluation of putatively scientific theories, according to which a theory is genuinely scientific only if it is possible in principle to establish that it is false.
Encyclopedia Brittanica
In practice, this popular version of falsifiability gives little guidance in evaluating whether an epidemiological model is reliable, a drug is safe or effective or a triple-A rated security is genuinely low risk. In actual scientific and engineering practice, we need a reliable estimate of how likely the apparent agreement of model and data is due to flexibility in the model from adjustable parameters, ad hoc changes to the mathematical model, and other causes such as data selection procedures. I will discuss this in more detail later in this article.
Karl Popper and The Logic of Scientific Discovery
The Austrian philosopher Karl Popper developed and presented a theory of falsifiability in his book The Logic of Scientific Discovery. This book is often cited and rarely read. My copy is 480 pages of small type.
Popper was especially concerned with rebutting the ostensibly scientific claims of Marxism and other ideologies. Popper was a deep thinker and understood that there were problems with a simple concept of falsifiability as I discuss next.
Falsifiability is largely encountered in disputes about religion and so-called pseudo-science, for example parapsychology. It is notably common in disputes over teaching evolution and creationism, the notion that God created the universe, life and human beings in some way, in schools. In the United States, creationism often refers to a literal or nearly literal interpretation of the Book of Genesis in the Bible.
This is a typical example from the RationalWiki arguing that creationism is not falsifiable and therefore is not science.
RationalWiki Example of the Common Use of Falsifiability
Remarkably, the doctrine of falsifiability is very rarely invoked in the scholarly scientific peer-reviewed literature, almost never outside of rare articles specifically rebutting the legitimacy of topics such as creationism and alleged pseudo-science. For example, a search of the arxiv.org preprint archive (1.6 million articles) turned up only eight matches for falsifiability and Popper as shown here.
Scientific and Engineering Citation of Falsifiability is Extremely Rare
In fact, there are many historical examples of scientific theories that could not be falsified but have been confirmed.
The existence of Black Swans, discovered in Australia. No matter how long one fails to find a single black swan, this does not mean they do not exist.
Stones falling from the sky, meteorites, were rejected by science for over a century despite many historical and anecdotal accounts of these remarkable objects.
A Black Swan and a Meteorite
What experiment could we reasonably now perform that would falsify the existence of black swans and meteorites? Does this mean they are not scientific even though they exist?
The Hebrew Bible
Divine creation of the world and the existence of God are both examples of propositions that are impossible to falsify or disprove, but they can be almost completely verified by evidence that would be accepted by nearly all people as almost conclusive.
For example if we were to discover the Hebrew text of the Bible encoded in a clear way in the DNA of human beings, this would be strong – not absolutely conclusive – evidence for divine creation.
If the Sun were to stop in its course for an hour tomorrow and a voice boom out from the Heavens: “This is God. I created the world and human beings. Make love not war.” this would be reasonably accepted as nearly conclusive evidence of God and creation.
The Matrix: The World is a Computer Simulation
Of course, any evidence for God or any other remarkable or unexpected phenomenon can be explained by invoking other extreme possibilities such as time travel, super-advanced space aliens or inter-dimensional visitors, or a computer simulation reality as in The Matrix movie.
I am not endorsing any religion or divine creation in making this point. I am simply pointing out the deep flaws in the doctrine of falsifiability as generally invoked.
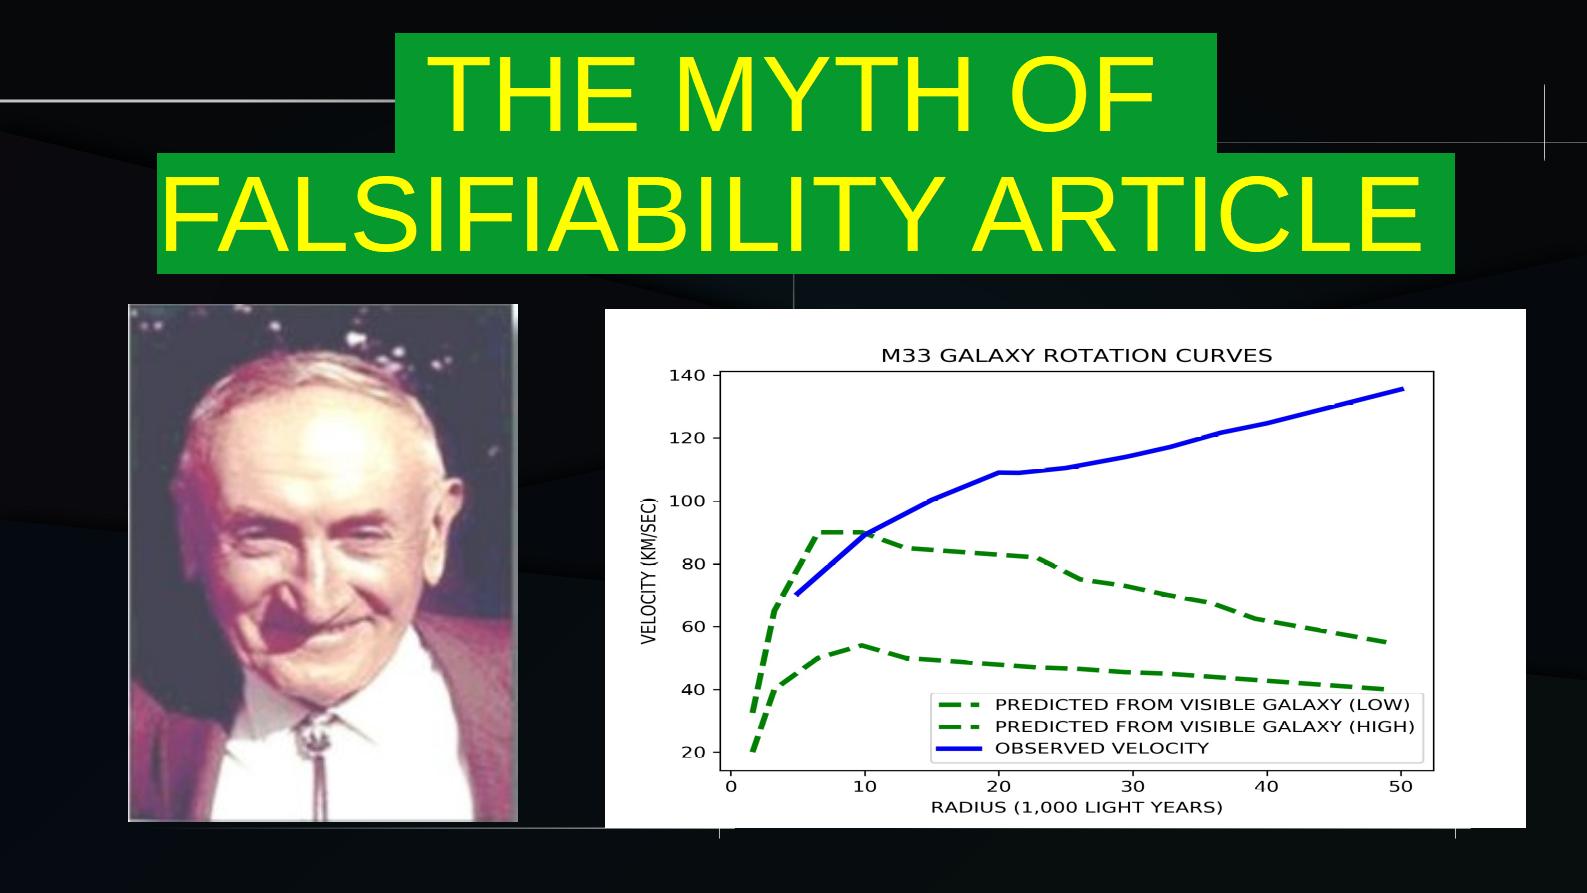
Fritz Zwicky and the Velocity Curves for the Triangulum Galaxy (Messier 33 or M33)
Let’s leave the world of religion and theology behind and take a look at the problems with falsifiability in mainstream scientific cosmology including the scientific account of creation, the Big Bang Theory.
In the 1930’s Fritz Zwicky, shown on the left, an astronomer at the California Institute of Technology (Caltech) noticed that the velocities of the orbit of stars in our Galaxy, the Milky Way, around the Galactic Center failed to decline with distance from the Galactic Center as predicted by both Newton’s theory of gravity and Einstein’s more recent General Theory of Relativity.
The plot on the right shows a similar dramatic discrepancy in a nearby galaxy, the Triangulum Galaxy, also known as Messier 33 (M33).
These observations would appear to falsify both Newton and Einstein’s theories of gravity in a dramatic way. Did scientists forthrightly falsify these theories as RationalWiki and other popular version of falsifiability claim they would?
NO. They did not. Instead they postulated a mysterious “dark matter” that could not be observed that fixed the gross discrepancy between theory and experiment.
In the last century, numerous additional discrepancies at the larger scales of clusters and super-clusters of galaxies have been observed, leading to the introduction of additional types of dark matter to get the theory to match the observations. None of these hypothetical dark matter candidates have ever been observed despite many searches.
Hubble Space Telescope
Einstein’s General Theory of Relativity originally included an additional term, usually known as the cosmological constant, to prevent the expansion of the universe. Einstein is reported to have called this term his “greatest blunder” after observations by Edwin Hubble showed otherwise unexplained extragalactic redshifts that could be explained as caused by the expansion of the universe, what is now called the Big Bang Theory.
The observation of the red shifts appeared to falsify Einstein’s theory. Einstein quickly dropped the cosmological constant term, achieving agreement with the data.
The Hubble Space Telescope discovered evidence that the expansion of the universe was accelerating, something the General Theory of Relativity failed to predict.
The Cosmological Term
Did scientists falsify the General Theory at this point? NO. Einstein had chosen the value of the cosmological constant to exactly balance the predicted expansion which initially contradicted known observations and theoretical prejudices. By using a different cosmological constant, modern scientists could reproduce the acceleration found by the Hubble.
Einstein, right even when he was wrong! Modern cosmologists attribute the non-zero cosmological constant to a mysterious dark energy permeating the universe. So far the dark energy, like the dark matter before it, has never been directly observed.
The modern Big Bang Theory incorporates other as yet unobserved entities such as “inflation” as well.
The Martian Epicycle
In practice, it is almost always possible to salvage a scientific theory by postulating undetected and perhaps unmeasurable entities such as dark matter, dark energy, inflation, and the original Ptolemaic epicycles.
In the Ptolemaic Earth-centered solar system Mars orbits the Earth. Mars is observed to back up in the Zodiac for about two months every two years. This clearly contradicted the Earth-centered model. This gross discrepancy was largely fixed by introducing an epicycle in which Mars orbits an invisible point which in turn orbits the Earth as shown in the plot on the right. The ancients interpreted Mars as a god or angel and justified the epicycles as complex dance moves dictated by the king of the gods or a monotheistic God.
In mathematical terms, a rigorous quantitative theory such as the General Theory of Relativity or Newton’s Theory of Gravity is a mathematical formula or expression. Discrepancies between these theories and observation can be resolved by adding, subtracting, or modifying different terms in the formula, such as the cosmological constant term. These modified terms often correspond to hypothetical entities such as dark energy.
MOND Alternative to General Relativity with Dark Matter
Many alternative theories to general relativity exist. MOND or Modified Newtonian Dynamics is the leading competitor at the moment. It can explain many (not all) observations without resorting to unobserved dark matter.
In fact, many complex mathematical theories such as those produced by modern machine learning and deep learning methods can “explain” the observations in scientific cosmology.
This is not surprising because complex theories with many adjustable parameters like the cosmological constant are plastic and can fit a wide range of data, in extreme cases like saran wrap can fit almost any solid surface.
A simple example of this saran wrap like behavior of complex mathematical formulae is the Taylor polynomial. A Taylor polynomial with enough terms can approximate almost any function arbitrarily well.
The Fourth (4th) Degree Taylor Polynomial Fitted to Periodic Data
The plot here shows a Taylor polynomial approximating a periodic function, the trigonometric sine, better and better as the degree, number of terms, increases.
Sixth (6th) Degree Taylor Polynomial Fitted to the Same Periodic Data Eighth (8th) Degree Taylor Polynomial Fitted to the Same Periodic DataTenth (10th) Degree Taylor Polynomial Fitted to the Same Periodic DataAll the Taylor Polynomial Models (Degrees 4,6,8, and 10) and Data in One Plot
The region of interest (ROI), containing the data used in the fit, is the region between the red triangle on the left and the red triangle on the right.
Notice the agreement with the data in the Region of Interest improves as the degree, the number of terms, increases. R SQUARED is roughly the fraction of the data explained by the model. Notice also the agreement for the Taylor Polynomial actually worsens outside the Region of Interest as the number of terms increases.
In general the Taylor Polynomial will predict new data within the Region of Interest well but new data outside the ROI poorly.
If agreement is poor, simply add more terms – like the cosmological constant – until agreement is acceptable.
This is why the Ptolemaic theory of planetary motion with epicycles could not be falsified.
Falsifiability Metric Table for Cosmology
Is Scientific Cosmology Falsifiable?
In real scientific practice, falsifiability is too vaguely defined and is not quantitative.
Falsifiability is not a simple binary, yes or no criterion in actual practice. Rather some theories are highly plastic and difficult to falsify. Some are less plastic, stiffer and easier to falsify. Falsifiability or plasticity is a continuum, not a simple binary yes or no, 0 or 1.0.
Falsifiability in Drug Approvals
Nonetheless, the question of falsifiability is of great practical importance. For example, many drugs are advertised as scientifically proven or strongly implied to be scientifically proven to reduce the risk of heart attacks and extend life, to slow the progression of cancer and extend life for cancer patients, and to effectively treat a range of psychological disorders such as paranoid schizophrenia, clinical depression, and Attention Deficit Hyperactivity Disorder (ADHD).
All of these claims have been questioned by a minority of highly qualified medical doctors, scientists, and investigative reporters.
Are these claims falsifiable? If not, are they therefore not scientific? How sure can we be that these drugs work? Does the doctrine of falsifiability give any insight into these critical questions?
Somehow we need to adjust the seeming agreement of models with data for the plasticity of the models – their ability to fit a wide range of data sets due to complexity.
Falsifiability in Drug Approvals
In Pharmaceutical Drug Approvals, the scientific theory being tested is that a drug is both safe and effective. Can erroneous claims of safety or effectiveness by pharmaceutical companies be falsified – not always it seems.
In the VIOXX scandal, involving a new pain reliever, marketed as a much more expensive super-aspirin that was safer than aspirin and other traditional pain relievers which can cause sometimes fatal gastrointestinal bleeding after prolonged use, scientists omitted several heart attacks, strokes, and deaths from the reported tallies for the treatment group.
This omission is similar to omitting the cosmological constant term in General Relativity. Indeed the ad hoc assumptions used to omit the injuries and deaths could be expressed mathematically as additional terms in a mathematical model of mortality as a function of drug dose.
Surveys of patients treated with VIOXX after approval showed higher heart attack, stroke, and death rates than patients treated with traditional pain relievers. Merck was nearly bankrupted by lawsuit settlements.
Vioxx: The Killer Pain Reliever Safer Than AspirinMerck Withdraws Vioxx from Market in 2004Merck Stock Drops
Falsifiability in Financial Risk Models
Falsifiability of Financial Risk Models
Moving from the world of drug risks to finance: the 2008 housing and financial crash was caused in part by reliance on financial risk models that underestimated the risk of home price declines and mortgage defaults.
Many of these models roughly assumed the popular Bell Curve, also known as the Normal or Gaussian distribution. The Bell Curve is frequently used in grading school work. It also tends to underestimate the risk of financial investments.
Are financial models falsifiable? Not always it seems.
Falsifiability of Coronavirus COVID-19 Pandemic Models
The public response to the current (April 12, 2020) Coronavirus COVID-19 Pandemic has been shaped by frequently complex, sometimes contradictory, and changing epidemiological models such as the widely cited Imperial College Model from the group headed by Professor Nell Ferguson as well as a competing model from Oxford — and many other models as well. There has been considerable well-justified controversy and confusion over these models.
Can we “falsify” these models in the popular binary “yes” or “no” sense of falsifiability? They are certainly imperfect and have failed various predictions, hence various revisions. Many key parameters such as the actual mortality rate broken down by age, sex, race, pre-existing medical conditions, and other risk factors have not been measured. The Imperial College Model is reportedly quite complex and may well be very “plastic” (not very falsifiable).
In fact, all or most of the models have been “falsified” in the binary falsification sense in real time as they have made predictions that failed and have been revised in various ways. Obviously a more nuanced measure, such as the falsifiability metric discussed below, is needed to evaluate the reliability of the models and compare them.
Falsifiability in Math Recognition
This is an example of the falsifiability problem in our work at Mathematical Software. We have a large, growing database of known mathematics, functions such as the Bell Curve and the Cauchy-Lorenz function shown here. Our math recognition software identifies the best candidate mathematical models for the data from this database.
The math recognizer yields an ordered list of candidate models ranked by goodness of fit, in this example the coefficient of determination, loosely the percent of agreement with the data.
The plot is an analysis of some financial data. On the vertical axis we have the percent agreement of the model with the data, One hundred percent is perfect agreement. Technically the value on the vertical axis is the coefficient of determination, often referred to as R squared.
On the horizontal axis is the probability of getting a return on investment less than the risk free return, the return from investing in a Treasury bond, about two (2) percent per year. This probability varies dramatically from model to model. It is a key metric for investment decisions.
Our best model is the Cauchy-Lorenz model, beating out the popular Bell Curve. BUT, what if the Cauchy-Lorenz is more plastic (less falsifiable) than the Bell Curve? The better agreement may be spurious. The difference in risk is enormous! Cauchy-Lorenz means a high risk investment and the Bell Curve means a low risk investment.
This problem has been encountered many times in statistics, data analysis, artificial intelligence, and many other related fields. A wide variety of ad hoc attempts to solve it have been offered in the scientific and engineering literature. For example, there are many competing formula to correct the coefficient of determination R**2 (R SQUARED) but there does not appear to be a rigorous and/or generally accepted solution or method. These adjusted R**2 formulae included Wherry’s formula, McNemar’s formula, Lord’s formula, and Stein’s formula (see graphic below).
Various Ad Hoc Adjustments for the Flexibility of Mathematical Models
The formulae do not, for example, take into account that different functions with the same number of adjustable parameters can have different degrees of plasticity/falsifiability.
In many fields, only the raw coefficient of determination R**2 is reported.
A Prototype Falsifiability Metric
This is an example of a prototype falsifiability metric illustrated with the Taylor Polynomials.
The metric consists of an overall falsifiability measure for the function, the value F in the title of each plot, and a function or curve adjusting the raw goodness of fit, the coefficient of determination or R SQUARED in this case, for each model.
The plots show the Taylor Polynomial A times X + B in the upper left, the Taylor Polynomial A times X squared plus B times X + C in the upper right, the 6th degree Taylor Polynomial in the lower left, and the tenth degree Taylor Polynomial in the lower right.
The red marker shows the adjusted value of an R SQUARED value of 0.9 or ninety percent.
As terms are added to the model the falsifiability decreases. It is easier for the more complex models to fit data generated by other functions! The Taylor Polynomials of higher degree are more and more plastic. This is reflected in the decreasing value of the falsifiability metric F.
In addition, the goodness of fit metric, R SQUARED here, is adjusted to compensate for the higher raw values of R SQUARED that a less falsifiable, more plastic function yields. An unfalsifiable function will always give R SQUARED of 1.0, the extreme case .The adjusted R**2 enables us to compare the goodness of fit for models with different numbers of terms and parameters, different levels of falsifiability.
Conclusion
Conclusion Slide
In conclusion, a simple “yes” or “no” binary falsifiability as commonly defined (e.g. in the Encyclopedia Brittanica) does not hold up in real scientific and engineering practice. It is too vaguely defined and not quantitative. It also excludes scientific theories that can be verified but not ruled out. For example, in the present (April 12, 2020) crisis, it is clearly useless in evaluating the many competing COVID-19 pandemic models and their predictions.
Falsifiability does reflect an actual problem. Scientific and engineering models — whether verbal conceptual models or rigorous quantitative mathematical models — can be and often are flexible or plastic, able to match many different sets of data and in the worse case such as the Taylor Polynomials, essentially any data set. Goodness of fit statistics such as R**2 are boosted by this plasticity/flexibility of the models making evaluation of performance and comparison of models difficult or impossible at present.
A reliable quantitative measure is needed. What is the (presumably Bayesian) probability that the agreement between a model and data is due to this flexibility of the model as opposed to a genuine “understanding” of the data? We are developing such a practical falsifiability measure here at Mathematical Software.
(C) 2020 by John F. McGowan, Ph.D.
About Me
John F. McGowan, Ph.D. solves problems using mathematics and mathematical software, including developing gesture recognition for touch devices, video compression and speech recognition technologies. He has extensive experience developing software in C, C++, MATLAB, Python, Visual Basic and many other programming languages. He has been a Visiting Scholar at HP Labs developing computer vision algorithms and software for mobile devices. He has worked as a contractor at NASA Ames Research Center involved in the research and development of image and video processing algorithms and technology. He has published articles on the origin and evolution of life, the exploration of Mars (anticipating the discovery of methane on Mars), and cheap access to space. He has a Ph.D. in physics from the University of Illinois at Urbana-Champaign and a B.S. in physics from the California Institute of Technology (Caltech).