[Python] How to compute future date with millisecond precision and timezone displayed

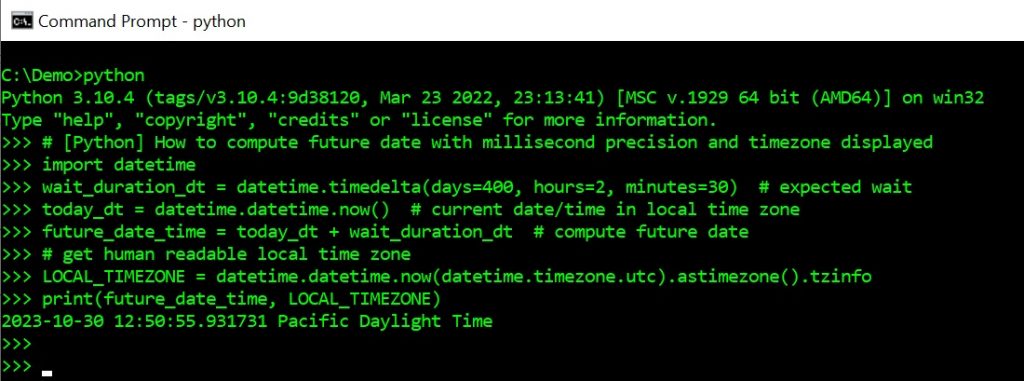
Use the Python datetime module as follows:

# [Python] How to compute future date with millisecond precision and timezone displayed
import datetime
wait_duration_dt = datetime.timedelta(days=400, hours=2, minutes=30)  # expected wait
today_dt = datetime.datetime.now()  # current date/time in local time zone
future_date_time = today_dt + wait_duration_dt  # compute future date
# get human readable local time zone
LOCAL_TIMEZONE = datetime.datetime.now(datetime.timezone.utc).astimezone().tzinfo
print(future_date_time, LOCAL_TIMEZONE)
(C) 2022 by John F. McGowan, Ph.D.

About Me

John F. McGowan, Ph.D. solves problems using mathematics and mathematical software, including developing gesture recognition for touch devices, video compression and speech recognition technologies. He has extensive experience developing software in C, C++, MATLAB, Python, Visual Basic and many other programming languages. He has been a Visiting Scholar at HP Labs developing computer vision algorithms and software for mobile devices. He has worked as a contractor at NASA Ames Research Center involved in the research and development of image and video processing algorithms and technology. He has published articles on the origin and evolution of life, the exploration of Mars (anticipating the discovery of methane on Mars), and cheap access to space. He has a Ph.D. in physics from the University of Illinois at Urbana-Champaign and a B.S. in physics from the California Institute of Technology (Caltech).

[Python] How to get function signature

How to get function signature in Python

Use:

import inspect
function_signature = inspect.signature(function_reference)

Full Example

#
# [Python] How to get function signature
#
import inspect

def myfunc(a, b, multiplier=1.0):
    return multiplier*(a + b)

print("myfunc(1,2) is:", myfunc(1,2))

sig = inspect.signature(myfunc)

msg = "function signature is: " + str(sig)
print(msg)

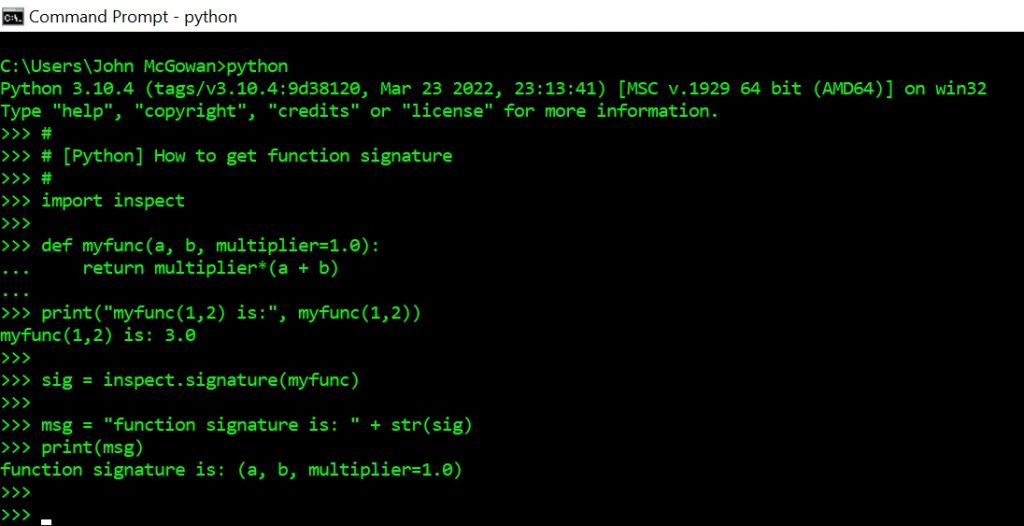
Note that the signature sig above is not a string (a Python str object). Must be cast to a Python str to concatenate with a string as shown in computing msg.

Python demonstration code output

(C) 2022 by John F. McGowan, Ph.D.

About Me

John F. McGowan, Ph.D. solves problems using mathematics and mathematical software, including developing gesture recognition for touch devices, video compression and speech recognition technologies. He has extensive experience developing software in C, C++, MATLAB, Python, Visual Basic and many other programming languages. He has been a Visiting Scholar at HP Labs developing computer vision algorithms and software for mobile devices. He has worked as a contractor at NASA Ames Research Center involved in the research and development of image and video processing algorithms and technology. He has published articles on the origin and evolution of life, the exploration of Mars (anticipating the discovery of methane on Mars), and cheap access to space. He has a Ph.D. in physics from the University of Illinois at Urbana-Champaign and a B.S. in physics from the California Institute of Technology (Caltech).

[Python] How to plot text in normalized coordinates in matplotlib

Normalized coordinates refers to plot coordinates where the horizontal and vertical axes run from 0.0 to 1.0 or zero percent to 100 percent of the plot dimensions. One often wants to position text labels or annotations in this way. This is NOT the default for the plt.text(…) function in matplotlib, the plotting add on module for Python that emulates MATLAB style plotting.

The key functions in matplotlib for normalized coordinates are:

ax = plt.gca()  # get the current axes of the plot
plt.text(x, y, "my text", transform=ax.transAxes, fontsize)

This is a short program showing the full use of these two function in context.

# How to plot text in normalized coordinates (0, 1) in matplotlib
# ax = plt.gca()  # get current plot axes object
# plt.text(x, y, string_message, transform = ax.transAxes, fontsize)

import numpy as np
import matplotlib.pyplot as plt
x = np.linspace(0.0, 10.0, 100)
y = 10*x**2
fig = plt.figure()
plt.title("How to plot text in normalized coordinates in matplotlib", fontsize=8)
plt.plot(x, y, 'g-', label='parabola')
# Plot text in normalized (0.0, 1.0) coordinates in matplotlib
ax = plt.gca()  # get current plot axes object
# NOTE: lowercase first letter of transAxes below
Y_POS = 0.91  # in range 0.0 to 1.0 (100%)
this_text = f"plt.text(0.01, {Y_POS}, \"this text\", transform=ax.transAxes"
plt.text(0.01, 0.95, "ax = plt.gca()", transform=ax.transAxes)
plt.text(0.01, Y_POS, this_text, transform=ax.transAxes)
#
plt.minorticks_on()
plt.grid(True, which='major', color='k')
plt.grid(True, which='minor')
plt.xlabel('X')
plt.ylabel('Y')
plt.show()
fig.savefig('matplotlib_normalized_coordinates.jpg', dpi=72)
Output Plot with key function text positioned in normalized coordinates

(C) 2022 by John F. McGowan, Ph.D.

About Me

John F. McGowan, Ph.D. solves problems using mathematics and mathematical software, including developing gesture recognition for touch devices, video compression and speech recognition technologies. He has extensive experience developing software in C, C++, MATLAB, Python, Visual Basic and many other programming languages. He has been a Visiting Scholar at HP Labs developing computer vision algorithms and software for mobile devices. He has worked as a contractor at NASA Ames Research Center involved in the research and development of image and video processing algorithms and technology. He has published articles on the origin and evolution of life, the exploration of Mars (anticipating the discovery of methane on Mars), and cheap access to space. He has a Ph.D. in physics from the University of Illinois at Urbana-Champaign and a B.S. in physics from the California Institute of Technology (Caltech).
[Python] How to combine two column vectors into a single column vector

How to combine two column vectors into a single column vector in Python and NumPy

Use the NumPy vstack(…) function as show below:

import numpy as np
one = np.array([[1], [2]])
two = np.array([[3], [4]])
blatz = np.vstack((one, two))
print(blatz)
[[1]
[2]
[3]
[4]] 
How to combine two column vectors into a single column vector in Python and NumPy using vstack

(C) 2022 by John F. McGowan, Ph.D.

About Me

John F. McGowan, Ph.D. solves problems using mathematics and mathematical software, including developing gesture recognition for touch devices, video compression and speech recognition technologies. He has extensive experience developing software in C, C++, MATLAB, Python, Visual Basic and many other programming languages. He has been a Visiting Scholar at HP Labs developing computer vision algorithms and software for mobile devices. He has worked as a contractor at NASA Ames Research Center involved in the research and development of image and video processing algorithms and technology. He has published articles on the origin and evolution of life, the exploration of Mars (anticipating the discovery of methane on Mars), and cheap access to space. He has a Ph.D. in physics from the University of Illinois at Urbana-Champaign and a B.S. in physics from the California Institute of Technology (Caltech).

[Video] Perpetual COVID Boosters: NO SURPRISE!

Video on BitChute

Other Uncensored Video Links: NewTube ARCHIVE

Short video on how perpetual COVID boosters were probably always the plan from the beginning. How pharmaceutical companies like Pfizer sell perpetual treatments by design and avoid cures.

About Us:

Main Web Site: https://mathematical-software.com/
Censored Search: https://censored-search.com/
A search engine for censored Internet content. Find the answers to your problems censored by advertisers and other powerful interests!

Subscribe to our free Weekly Newsletter for articles and videos on practical mathematics, Internet Censorship, ways to fight back against censorship, and other topics by sending an email to: subscribe [at] mathematical-software.com

Avoid Internet Censorship by Subscribing to Our RSS News Feed: http://wordpress.jmcgowan.com/wp/feed/

Legal Disclaimers: http://wordpress.jmcgowan.com/wp/legal/

Support Us:
PATREON: https://www.patreon.com/mathsoft
SubscribeStar: https://www.subscribestar.com/mathsoft

Rumble (Video): https://rumble.com/c/mathsoft
BitChute (Video): https://www.bitchute.com/channel/HGgoa2H3WDac/
Brighteon (Video): https://www.brighteon.com/channels/mathsoft
Odysee (Video): https://odysee.com/@MathematicalSoftware:5
NewTube (Video): https://newtube.app/user/mathsoft
Minds (Video): https://www.minds.com/math_methods/
Archive (Video): https://archive.org/details/@mathsoft

(C) 2022 by John F. McGowan, Ph.D.

About Me

John F. McGowan, Ph.D. solves problems using mathematics and mathematical software, including developing gesture recognition for touch devices, video compression and speech recognition technologies. He has extensive experience developing software in C, C++, MATLAB, Python, Visual Basic and many other programming languages. He has been a Visiting Scholar at HP Labs developing computer vision algorithms and software for mobile devices. He has worked as a contractor at NASA Ames Research Center involved in the research and development of image and video processing algorithms and technology. He has published articles on the origin and evolution of life, the exploration of Mars (anticipating the discovery of methane on Mars), and cheap access to space. He has a Ph.D. in physics from the University of Illinois at Urbana-Champaign and a B.S. in physics from the California Institute of Technology (Caltech).