How to Tell Scientifically if Advertising Works Explainer Video
[Slide 1]
“Half the money
I spend on advertising is wasted; the trouble is I don’t know which
half.”
This popular quote
sums up the problem with advertising.
[Slide 2]
There are many
advertising choices today including not advertising, relying on word
of mouth and other “organic” growth. Is the advertising
working?
[Slide 3]
Proxy measures such
as link clicks can be highly misleading. A bad advertisement can get
many clicks, even likes but reduce sales by making the product look
bad in an entertaining way.
[Animation Enter]
[Wait 2 seconds]
[Slide 4]
Did the advertising
increase sales and profits? This requires analysis of the product
sales and advertising expenses from your accounting program such as
QuickBooks. Raw sales reports are often difficult to interpret
unless the boost in sales is extremely large such as doubling sales.
Sales are random like flipping a coin. This means a small but
profitable increase such as twenty percent is often difficult to
distinguish from chance alone.
[Slide 5]
Statistical analysis
and computer simulation of a business can give a quantitative,
PREDICTIVE answer. We can measure the fraction of days with zero,
one, two, or more unit sales with advertising — the green bars in
the plot shown — and without advertising, the blue bars.
[Slide 6]
With these
fractions, we can simulate the business with and without advertising.
The bar chart shows
the results for one thousand simulations of a year of business
operations. Because sales are random like flipping a coin, there
will be variations in profit from simulation to simulation due to
chance alone.
The horizontal axis
shows the change in profits in the simulation compared to the actual
sales without advertising. The height of the bars shows the FRACTION
of the simulations with the change in profits on the horizontal axis.
The blue bars are
the fractions for one-thousand simulations without advertising.
[Animation Enter]
The green bars are
the fractions for one-thousand simulations with advertising.
[Animation Enter]
The vertical red bar
shows the average change in profits over ALL the simulations WITH THE
ADVERTISING.
There is ALWAYS an
increased risk from the fixed cost of the advertising — $500 per
month, $6,000 per year in this example. The green bars in the lower
left corner show the increased risk with advertising compared to the
blue bars without advertising.
If the advertising
campaign increases profits on average and we can afford the increased
risk, we should continue the advertising.
[Slide 7]
This analysis was
performed with Mathematical Software’s AdEvaluator Free Open Source
Software. AdEvaluator works for sales data where there is a SINGLE
change in the business, a new advertising campaign.
Our AdEvaluator Pro
software for which we will charge money will evaluate cases with
multiple changes such as a price change and a new advertising
campaign overlapping.
Click on the
Downloads TAB for our Downloads page.
[Web Site Animation
Exit]
[Download Links
Animation Entrance]
AdEvaluator can be
downloaded from GitHub or as a ZIP file directly from the downloads
page on our web site.
[Download Links
Animation Exit]
Or scan this QR code
to go to the Downloads page.
This is John F.
McGowan, Ph.D., CEO of Mathematical Software. I have many years
experience solving problems using mathematics and mathematical
software including work for Apple, HP Labs, and NASA. I can be
reached at ceo@mathematical-software.com
John F. McGowan, Ph.D. solves problems using mathematics and mathematical software, including developing gesture recognition for touch devices, video compression and speech recognition technologies. He has extensive experience developing software in C, C++, MATLAB, Python, Visual Basic and many other programming languages. He has been a Visiting Scholar at HP Labs developing computer vision algorithms and software for mobile devices. He has worked as a contractor at NASA Ames Research Center involved in the research and development of image and video processing algorithms and technology. He has published articles on the origin and evolution of life, the exploration of Mars (anticipating the discovery of methane on Mars), and cheap access to space. He has a Ph.D. in physics from the University of Illinois at Urbana-Champaign and a B.S. in physics from the California Institute of Technology (Caltech).
AdEvaluator™ evaluates the effect of advertising (or marketing, sales, or public relations) on sales and profits by analyzing a sales report in comma separated values (CSV) format from QuickBooks or other accounting programs. It requires a reference period without the advertising and a test period with the advertising. The advertising should be the only change between the two periods. There are some additional limitations explained in the on-line help for the program.
(C) 2019 by John F. McGowan, Ph.D.
About Me
John F. McGowan, Ph.D. solves problems using mathematics and mathematical software, including developing gesture recognition for touch devices, video compression and speech recognition technologies. He has extensive experience developing software in C, C++, MATLAB, Python, Visual Basic and many other programming languages. He has been a Visiting Scholar at HP Labs developing computer vision algorithms and software for mobile devices. He has worked as a contractor at NASA Ames Research Center involved in the research and development of image and video processing algorithms and technology. He has published articles on the origin and evolution of life, the exploration of Mars (anticipating the discovery of methane on Mars), and cheap access to space. He has a Ph.D. in physics from the University of Illinois at Urbana-Champaign and a B.S. in physics from the California Institute of Technology (Caltech).
How to Tell Scientifically if Advertising Boosts Profits Video
Short (seven and one half minute) video showing how to evaluate scientifically if advertising boosts profits using mathematical modeling and statistics with a pitch for our free open source AdEvaluator™ software and a teaser for our non-free AdEvaluator Pro™software — coming soon.
John F. McGowan, Ph.D. solves problems using mathematics and mathematical software, including developing gesture recognition for touch devices, video compression and speech recognition technologies. He has extensive experience developing software in C, C++, MATLAB, Python, Visual Basic and many other programming languages. He has been a Visiting Scholar at HP Labs developing computer vision algorithms and software for mobile devices. He has worked as a contractor at NASA Ames Research Center involved in the research and development of image and video processing algorithms and technology. He has published articles on the origin and evolution of life, the exploration of Mars (anticipating the discovery of methane on Mars), and cheap access to space. He has a Ph.D. in physics from the University of Illinois at Urbana-Champaign and a B.S. in physics from the California Institute of Technology (Caltech).
John F. McGowan, Ph.D. solves problems using mathematics and mathematical software, including developing gesture recognition for touch devices, video compression and speech recognition technologies. He has extensive experience developing software in C, C++, MATLAB, Python, Visual Basic and many other programming languages. He has been a Visiting Scholar at HP Labs developing computer vision algorithms and software for mobile devices. He has worked as a contractor at NASA Ames Research Center involved in the research and development of image and video processing algorithms and technology. He has published articles on the origin and evolution of life, the exploration of Mars (anticipating the discovery of methane on Mars), and cheap access to space. He has a Ph.D. in physics from the University of Illinois at Urbana-Champaign and a B.S. in physics from the California Institute of Technology (Caltech).
John Wanamaker, (attributed) US department store merchant (1838 – 1922)
Between $190 billion and $270 billion is spent on advertising in the United States each year (depending on source). It is often hard to tell whether the advertising boosts sales and profits. This is caused by the unpredictability of individual sales and in many cases the other changes in the business and business environment occurring in addition to the advertising. In technical terms, the evaluation of the effect of advertising on sales and profits is often a multidimensional problem.
Many common metrics such as the number of views, click through rates (CTR), and others do not directly measure the change in sales or profits. For example, an embarrassing or controversial video can generate large numbers of views, shares, and even likes on a social media site and yet cause a sizable fall in sales and profits.
Because individual sales are unpredictable, it is often difficult or impossible to tell whether a change in sales is caused by advertising, simply due to chance alone or some combination of advertising and luck.
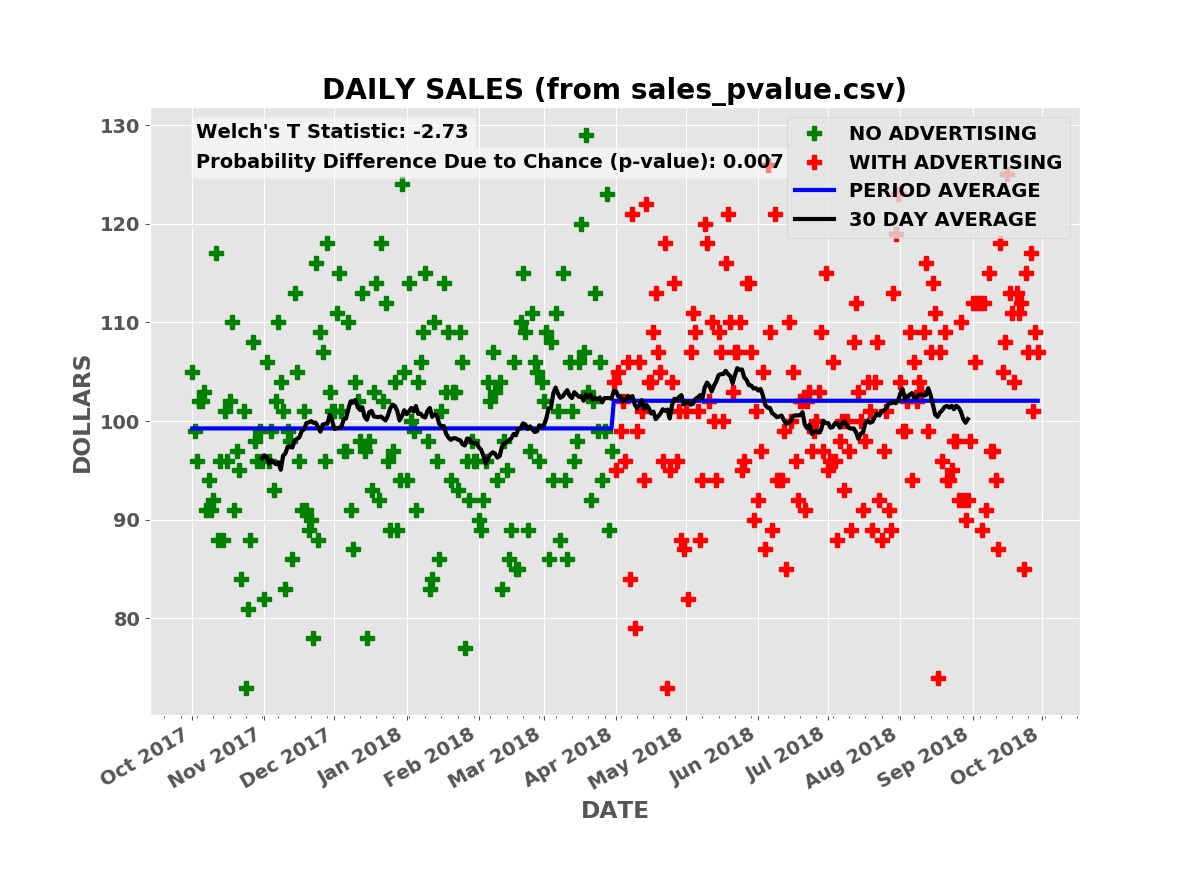
The plot below shows the simulated daily sales for a product or service with a price of $90.00 per unit. Initially, the business has no advertising, relying on word of mouth and other methods to acquire and retain customers. During this “no advertising” period, an average of three units are sold per day. The business then contracts with an advertising service such as Facebook, Google AdWords, Yelp, etc. During this “advertising” period, an average of three and one half units are sold per day.
Daily Sales
The raw daily sales data is impossible to interpret. Even looking at the thirty day moving average of daily sales (the black line), it is far from clear that the advertising campaign is boosting sales.
Taking the average daily sales over the “no advertising” period, the first six months, and over the “advertising” period (the blue line), the average daily sales was higher during the advertising period.
Is the increase in sales due to the advertising or random chance or some combination of the two causes? There is always a possibility that the sales increase is simply due to chance. How much confidence can we have that the increase in sales is due to the advertising and not chance?
This is where statistical methods such as Student’s T test, Welch’s T test, mathematical modeling and computer simulations are needed. These methods compute the effectiveness of the advertising in quantitative terms. These quantitative measures can be converted to estimates of future sales and profits, risks and potential rewards, in dollar terms.
Measuring the Difference Between Two Random Data Sets
In most cases, individual sales are random events like the outcome of flipping a coin. Telling whether sales data with and without advertising is the same is similar to evaluating whether two coins have the same chances of heads and tails. A “fair” coin is a coin with an equal chance of giving a head or a tail when flipped. An “unfair” coin might have a three fourths chance of giving a head and only a one quarter chance of giving a tail when flipped.
If I flip each coin once, I cannot tell the difference between the fair coin and the unfair coin. If I flip the two coins ten times, on average I will get five heads from the fair coin and seven and one half (seven or eight) heads from the unfair coin. It is still hard to tell the difference. With one hundred times, the fair coin will average fifty heads and the unfair coin seventy-five heads. There is still a small chance that the seventy five heads came from a fair coin.
The T statistics used in Student’s T test (Student was a pseudonym used by statistician William Sealy Gossett) and Welch’s T test, a more advanced T test, are measures of the difference in a statistical sense between two random data sets, such as the outcome of flipping coins one hundred times. The larger the T statistic the more different the two random data sets in a statistical sense.
William Sealy Gossett (Student)
Student’s T test and Welch’s T test convert the T statistics into probabilities that the difference between the two data sets (the “no advertising” and “advertising” sales data in our case) is due to chance. Student’s T test and Welch’s T test are included in Excel and many other financial and statistical programs.
The plot below is a histogram (bar chart) of the number of simulations with a Welch’s T statistic value. In these simulations, the advertising has no effect on the daily sales (or profits). The advertising has no effect is the null hypothesis in the language of classical statistics.
Welch’s T Statistics
Welch was able to derive a mathematical formula for the expected distribution — shape of this histogram — using calculus. The mathematical formula could then be evaluated quickly with pencil and paper or an adding machine, the best available technology of his time (the 1940’s).
To derive his formula using calculus, Welch had to assume that the data had a Bell Curve (Normal or Gaussian) distribution. This is at best only approximately true for the sales data above. The distribution of daily sales in the simulated data is actually the Poisson distribution. The Poisson distribution is a better model of sales data and approximates the Bell Curve as the number of sales gets larger. This is why Welch’s T test is often approximately valid for sales data.
Many methods and tests in classical statistics assume a Bell Curve (Normal or Gaussian) distribution and are often approximately correct for real data that is not Bell Curve data. We can compute better, more reliable results with computer simulations using the actual or empirical probability distributions — shown below.
Welch’s T Statistic has Bell Curve Shape
More precisely, naming one data set the reference data and the other data set the test data, the T test computes the probability that the test data is due to a chance variation in the process that produced the reference data set. In the advertising example above, the “no advertising” period sales data is the reference data and the “advertising” sales data is the test data. Roughly this probability is the fraction of simulations in the Welch’s T statistic histogram that have a T statistic larger (or smaller for a negative T statistic) than the measured T statistic for the actual data. This probability is known as a p-value, a widely used statistic pioneered by Ronald Fisher.
Ronald Aylmer Fisher at the start of his career
The p-value has some obvious drawbacks for a business evaluating the effectiveness of advertising. At best it only tells us the probability that the advertising boosted sales or profits, not how large the boost was nor the risks. Even if on average the advertising boosts sales, what is the risk the advertising will fail or the sales increase will be too small to recover the cost of the advertising?
Fisher worked for Rothamsted Experimental Station in the United Kingdom where he wanted to know whether new breeds of crops, fertilizers, or other new agricultural methods increased yields. His friend and colleague Gossett worked for the Guinness beer company where he was working on improving yields and quality of beer. In both cases, they wanted to know whether a change in the process had a positive effect, not the size of the effect. Without modern computers — using only pencil and paper and adding machines — it was not practical to perform simulations as we can easily today.
Welch’s T statistic has a value of -3.28 for the above sales data. This is in fact lower than nearly all the simulations in the histogram. It is very unlikely the boost in sales is due to chance. The p-value from Welch’s T test for the advertising data above — computed using Welch’s mathematical formula — is only 0.001 (one tenth of one percent). Thus it is very likely the boost in sales is caused by the advertising and not random chance. Note that this does not tell us if the size of the boost, whether the advertising is cost effective, or the risk of the investment.
Sales and Profit Projections Using Computer Simulations
We can do much better than Student’s T test and Welch’s T test by using computer simulations based on the empirical probabilities of sales from the reference data — the “no advertising” period sales data. The simulations use random number generators to simulate the random nature of individual sales.
In these simulations, we simulate one year of business operations with advertising many times — one-thousand in the examples shown — using the frequency of sales from the period with advertising. We also simulate one year of business operations without the advertising, using the frequency of sales from the period without advertising in the sales data.
Frequency of Daily Sales in Both Periods
We compute the annual change in the profit relative to the corresponding period — with or without advertising — in the sales data for each simulated year of business operations.
Annual Profit Projections
The simulations show that we have an average expected increase in profit of $5,977.66 over one year (our annual advertising cost is $6,000.00). It also shows that despite this there is a risk of a decrease in profits, some greater than the possible decreases with no advertising.
A business needs to know both the risks — how much money might be lost in a worst case — and the rewards — the average and best possible returns on the advertising investment.
Since sales are a random process like flipping a coin or throwing dice, there is a risk of a decline in profits or actual losses without the advertising. The question is whether the risk with advertising is greater, smaller, or the same. This is known as differential risk.
The Problem with p-values
This is a concrete example of the problem with p-values for evaluating the effectiveness of advertising. In this case, the advertising increases the average daily sales from 100 units per day to 101 units per day. Each unit costs one dollar (a candy bar for example).
P-VALUE SHOWS BOOST IN SALES
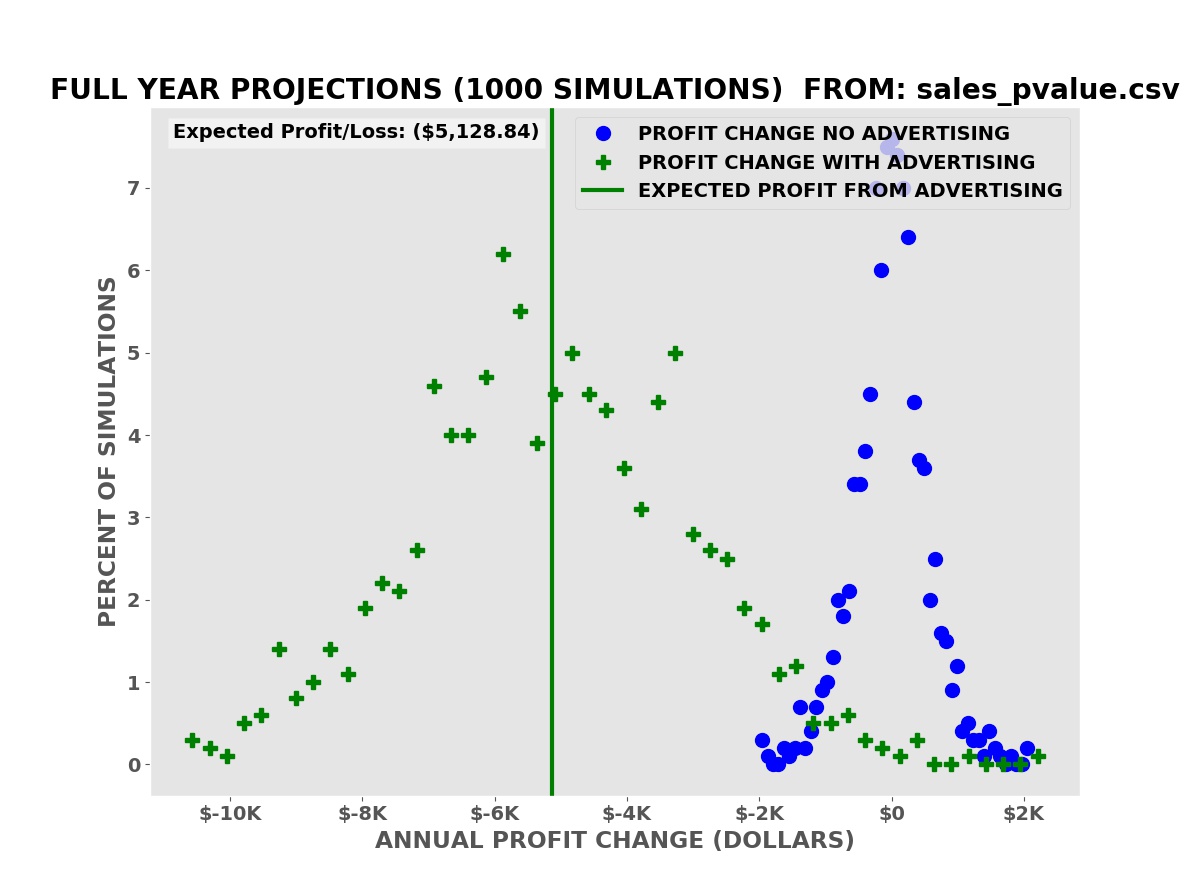
The p-value from Welch’s T test is 0.007 (seven tenths of one percent). The advertising is almost certainly effective but the boost in sales is much less than the cost of the advertising:
Profit Projections
The average expected decline in profits over the simulations is $5,128.84.
The p-value is not a good estimate of the potential risks and rewards of investing in advertising. Sales and profit projections from computer simulations based on a mathematical model derived from the reference sales data are a better (not perfect) estimate of the risks and rewards.
Multidimensional Sales Data
The above examples are simple cases where the only change is the addition of the advertising. There are no price changes, other advertising or marketing expenses, or other changes in business or economic conditions. There are no seasonal effects in the sales.
Student’s T test, Welch’s T test, and many other statistical tests are designed and valid only for simple controlled cases such as this where there is only one change between the reference and test data. These tests were well suited to data collected at the Rothamsted Experimental Station, Guinness breweries, and similar operations.
Modern businesses purchasing advertising from Facebook, other social media services, and modern media providers (e.g. the New York Times) face more complex conditions with many possible input variables (unit price, weather, unemployment rate, multiple advertising services, etc.) changing frequently or continuously.
For these, financial analysts need to extract predictive multidimensional mathematical models from the data and then perform similar simulations to evaluate the effect of advertising on sales and profits.
AdEvaluator™ is designed for cases with a single product or service with a constant unit price during both periods. AdEvaluator™ needs a reference period without the new advertising and a test period with the new advertising campaign. The new advertising campaign should be the only significant change between the two periods. AdEvaluator™ also assumes that the probability of the daily sales is independent and identically distributed during each period. This is not true in all cases. Exercise your professional business judgement whether the results of the simulations are applicable to your business.
This program comes with ABSOLUTELY NO WARRANTY; for details use -license option at the command line or select Help | License… in the graphical user interface (GUI). This is free software, and you are welcome to redistribute it under certain conditions.
We are developing a professional version of AdEvaluator™ for multidimensional cases. This version uses our Math Recognition™ technology to automatically identify good multidimensional mathematical models.
The Math Recognition™ technology is applicable to many types of data, not just sales and advertising data. It can for example be applied to complex biological systems such as the blood coagulation system which causes heart attacks and strokes when it fails. According the US Centers for Disease Control (CDC) about 633,000 people died from heart attacks and 140,000 from strokes in 2016.
Conclusion
It is often difficult to evaluate whether advertising is boosting sales and profits, despite the ready availability of sales and profit data for most businesses. This is caused by the unpredictable nature of individual sales and frequently by the complex multidimensional business environment where price changes, economic downturns and upturns, the weather, and other factors combine with the advertising to produce a confusing picture.
In simple cases with a single change, the addition of the new advertising, Student’s T test, Welch’s T test and other methods from classical statistics can help evaluate the effect of the advertising on sales and profits. These statistical tests can detect an effect but provide no clear estimate of the magnitude of the effect on sales and profits and the financial risks and rewards.
Sales and profit projections based on computer simulations using the empirical probability of sales from the actual sales data can provide quantitative estimates of the effect on sales and profits, including estimates of the financial risks (chance of losing money) and the financial rewards (typical and best case profits).
(C) 2018 by John F. McGowan, Ph.D.
About Me
John F. McGowan, Ph.D. solves problems using mathematics and mathematical software, including developing gesture recognition for touch devices, video compression and speech recognition technologies. He has extensive experience developing software in C, C++, MATLAB, Python, Visual Basic and many other programming languages. He has been a Visiting Scholar at HP Labs developing computer vision algorithms and software for mobile devices. He has worked as a contractor at NASA Ames Research Center involved in the research and development of image and video processing algorithms and technology. He has published articles on the origin and evolution of life, the exploration of Mars (anticipating the discovery of methane on Mars), and cheap access to space. He has a Ph.D. in physics from the University of Illinois at Urbana-Champaign and a B.S. in physics from the California Institute of Technology (Caltech).
This is a short article on how to control the order of slides in a slideshow on the Microsoft Windows 10 operating system. Slideshows can be quickly launched in Windows 10 using the Windows File Explorer by selecting the Manage tab and clicking on the Slideshow Icon.
Slide show icon in File Explorer
Usually, Windows 10 will display the picture files in the folder in the order displayed in the file explorer: alphabetically if Name is selected, by date if Date is selected, by file size if Size is selected, etc. In my experience on my system, this occasionally does not happen and the files are displayed alphabetically even though another view is selected. Thus, it is probably best to use alphabetical file names to ensure that the files display as desired.
Note that on Windows (and many computer systems) the numbers 0-9 come before A-Z, thus files that start with a number such as 000my_file_name.jpg will display before files that start with a letter such as my_file_name.jpg. In the example below, I use the prefix 000 to display the picture of George Washington first.
Alphabetical View in File Explorer
To display the Presidents in chronological order, I add a numeric prefix to each file in the folder. George Washington is the first President of the United States. John Adams is the second. Thomas Jefferson third. Andrew Jackson seventh. Abraham Lincoln sixteenth. Theodore Roosevelt twenty-sixth. Donald Trump forty-fifth.
Slideshow with US Presidents Ordered in Chronological Order
By default, Windows 10 plays the slide show in Loop mode with Shuffle mode off. In this mode, the slides are displayed in order.
Loop Mode Showing George Washington First
Right clicking with the mouse or other pointing device during the slide show brings up a popup menu with the Loop and Shuffle modes as well as other controls.
In the shuffle mode, the first slide is always displayed first. I will still get George Washington first in my example. All subsequent slides are displayed in random order. This seems like a bug; I would prefer the first slide to also be random.
Shuffle Mode Showing George Washington First
NOTE: If for some reason you do not like the first slide displayed every time in shuffle mode, add a prefix to a picture file that you would prefer to be first to place it alphabetically before all other picture files in the folder.
Once shuffle mode or other controls (slow or fast for example) are selected, the selections remain in force for subsequent slide shows until changed.
That is how to control the order of slides in a slide show in Microsoft Windows 10.
This is a short video on how to control the order of slides in a slide show on Windows 10:
(C) 2018 by John F. McGowan, Ph.D.
About Me
John F. McGowan, Ph.D. solves problems using mathematics and mathematical software, including developing gesture recognition for touch devices, video compression and speech recognition technologies. He has extensive experience developing software in C, C++, MATLAB, Python, Visual Basic and many other programming languages. He has been a Visiting Scholar at HP Labs developing computer vision algorithms and software for mobile devices. He has worked as a contractor at NASA Ames Research Center involved in the research and development of image and video processing algorithms and technology. He has published articles on the origin and evolution of life, the exploration of Mars (anticipating the discovery of methane on Mars), and cheap access to space. He has a Ph.D. in physics from the University of Illinois at Urbana-Champaign and a B.S. in physics from the California Institute of Technology (Caltech).
It is common to encounter claims of a “desperate” or “severe” shortage of STEM (Science, Technology, Engineering, and Mathematics) workers, either current or projected, usually from employers of STEM workers. These claims are perennial and date back at least to the 1940’s after World War II despite the huge number of STEM workers employed in wartime STEM projects (the Manhattan Project that developed the atomic bomb, military radar, code breaking machines and computers, the B-29 and other high tech bombers, the development of penicillin, K-rations, etc.). This article takes a look at the STEM degree numbers in the National Science Foundation’s Science and Engineering Indicators 2018 report.
College STEM Degrees (NSF Science and Engineering Indicators 2018)
I looked at the total Science and Engineering bachelors degrees granted each year which includes degrees in Social Science, Psychology, Biological and agricultural sciences as well as hard core Engineering, Computer Science, Mathematics, and Physical Sciences. I also looked specifically at the totals for “hard” STEM degrees (Engineering, Computer Science, Mathematics, and Physical Sciences). I also included the total number of K-12 students who pass (score 3,4, or 5 out of 5) on the Advanced Placement (AP) Calculus Exam (either the AB exam or the more advanced BC exam) each year.
I fitted an exponential growth model to each data series. The exponential growth model fits well to the total STEM degrees and AP passing data. The exponential growth model roughly agrees with the hard STEM degree data, but there is a clear difference, reflected in the coefficient of determination (R-SQUARED) of 0.76 meaning the model explains about 76 percent of the variation in the data.
One can easily see the the number of hard STEM degrees significantly exceeds the trend line in the early 00’s (2000 to about 2004) and drops well below from 2004 to 2008, rebounding in 2008. This probably reflects the surge in CS degrees specifically due to the Internet/dot com bubble (1995-2001).
There appears to be a lag of about four years between the actual dot com crash usually dated to a stock market drop in March of 2000 and the drop in production of STEM bachelor’s degrees in about 2004.
Analysis results:
TOTAL Scientists and Engineers 2016: 6,900,000

ALL STEM Bachelor's Degrees
ESTIMATED TOTAL IN 2016 SINCE 1970: 15,970,052
TOTAL FROM 2001 to 2015 (Science and Engineering Indicators 2018)  7,724,850
ESTIMATED FUTURE STUDENTS (2016 to 2026): 8,758,536
ANNUAL GROWTH RATE:  3.45 %  US POPULATION GROWTH RATE (2016): 0.7 %

HARD STEM DEGREES ONLY (Engineering, Physical Sciences, Math, CS)
ESTIMATED TOTAL IN 2016 SINCE 1970: 5,309,239
TOTAL FROM 2001 to 2015 (Science and Engineering Indicators 2018)  2,429,300
ESTIMATED FUTURE STUDENTS (2016 to 2026): 2,565,802
ANNUAL GROWTH RATE:  2.88 %  US POPULATION GROWTH RATE (2016): 0.7 %

STUDENTS PASSING AP CALCULUS EXAM
ESTIMATED TOTAL IN 2016 SINCE 1970: 5,045,848
TOTAL FROM 2002 to 2016  (College Board)  3,038,279
ESTIMATED FUTURE STUDENTS (2016 to 2026): 4,199,602
ANNUAL GROWTH RATE:  5.53 %  US POPULATION GROWTH RATE (2016): 0.7 %
estimate_college_stem.py ALL DONE
The table below gives the raw numbers from Figure 02-10 in the NSF Science and Engineering Indicators 2018 report with a column for total STEM degrees and a column for total STEM degrees in hard science and technology subjects (Engineering, Computer Science, Mathematics, and Physical Sciences) added for clarity:
STEM Degrees Table fig02-10 Revised
In the raw numbers, we see steady growth in social science and psychology STEM degrees from 2000 to 2015 with no obvious sign of the Internet/dot com bubble. There is a slight drop in Biological and agricultural sciences degrees in the early 00s. Somewhat larger drops can be seen in Engineering and Physical Sciences degrees in the early 00’s as well as a concomittant sharp rise in Computer Science (CS) degrees. This probably reflects strong STEM students shifting into CS degrees.
The number of K-12 students taking and passing the AP Calculus Exam (either the AB or more advanced BC exam) grows continuously and rapidly during the entire period from 1997 to 2016, growing at over five percent per year, far above the United States population growth rate of 0.7 percent per year.
The number of college students earning hard STEM degrees appears to be slightly smaller than the four year lagged number of K-12 students passing the AP exam, suggesting some attrition of strong STEM students at the college level. We might expect the number of hard STEM bachelors degrees granted each year to be the same or very close to the number of AP Exam passing students four years earlier.
A model using only the hard STEM bachelors degree students gives a total number of STEM college students produced since 1970 of five million, pretty close to the number of K-12 students estimated from the AP Calculus exam data. This is somewhat less than the 6.9 million total employed STEM workers estimated by the United States Bureau of Labor Statistics.
Including all STEM degrees gives a huge surplus of STEM students/workers, most not employed in a STEM field as reported by the US Census and numerous media reports.
The hard STEM degree model predicts about 2.5 million new STEM workers graduating between 2016 and 2026. This is slightly more than the number of STEM job openings seemingly predicted by the Bureau of Labor Statistics (about 800,000 new STEM jobs and about 1.5 million retirements and deaths of current aging STEM workers giving a total of about 2.3 million “new” jobs). The AP student model predicts about 4 million new STEM workers, far exceeding the BLS predictions and most other STEM employment predictions.
The data and models do not include the effects of immigration and guest worker programs such as the controversial H1-B visa, L1 visa, OPT visa, and O (“Genius”) visa. Immigrants and guest workers play an outsized role in the STEM labor force and specifically in the computer science/software labor force (estimated at 3-4 million workers, over half of the STEM labor force).
Difficulty of Evaluating “Soft” STEM Degrees
Social science, psychology, biological and agricultural sciences STEM degrees vary widely in rigor and technical requirements. The pioneering statistician Ronald Fisher developed many of his famous methods as an agricultural researcher at the Rothamsted agricultural research institute. The leading data analysis tool SAS from the SAS Institute was originally developed by agricultural researchers at North Carolina State University. IBM’s SPSS (Statistics Package for Social Sciences) data analysis tool, number three in the market, was developed for social sciences. Many “hard” sciences such as experimental particle physics use methods developed by Fisher and other agricultural and social scientists. Nonetheless, many “soft” science STEM degrees do not involve the same level of quantitative, logical, and programming skills typical of “hard” STEM fields.
In general, STEM degrees at the college level are not highly standardized. There is no national or international standard test or tests comparable to the AP Calculus exams at the K-12 level to get a good national estimate of the number of qualified students.
The numbers suggest but do not prove that most K-12 students who take and pass AP Calculus continue on to hard STEM degrees or some type of rigorous biology or agricultural sciences degree — hence the slight drop in biology and agricultural science degrees during the dot com bubble period with students shifting to CS degrees.
Conclusion
Both the college “hard” STEM degree data and the K-12 AP Calculus exam data strongly suggest that the United States can and will produce more qualified STEM students than job openings predicted for the 2016 to 2026 period. Somewhat more according to the college data, much more according to the AP exam data, and a huge surplus if all STEM degrees including psychology and social science are considered. The data and models do not include the substantial number of immigrants and guest workers in STEM jobs in the United States.
NOTE: The raw data in text CSV (comma separated values) format and the Python analysis program are included in the appendix below.
(C) 2018 by John F. McGowan, Ph.D.
About Me
John F. McGowan, Ph.D. solves problems using mathematics and mathematical software, including developing gesture recognition for touch devices, video compression and speech recognition technologies. He has extensive experience developing software in C, C++, MATLAB, Python, Visual Basic and many other programming languages. He has been a Visiting Scholar at HP Labs developing computer vision algorithms and software for mobile devices. He has worked as a contractor at NASA Ames Research Center involved in the research and development of image and video processing algorithms and technology. He has published articles on the origin and evolution of life, the exploration of Mars (anticipating the discovery of methane on Mars), and cheap access to space. He has a Ph.D. in physics from the University of Illinois at Urbana-Champaign and a B.S. in physics from the California Institute of Technology (Caltech).
Year,Social sciences,Biological and agricultural sciences,Psychology,Engineering,Computer sciences,Physical sciences,Mathematics and statistics,Total STEM,Total Hard STEM
2000,113.50,83.13,74.66,59.49,37.52,18.60,11.71,398.61,127.32
2001,114.47,79.48,74.12,59.21,43.60,18.11,11.44,400.43,132.36
2002,119.11,79.03,77.30,60.61,49.71,17.98,12.25,415.99,140.55
2003,129.74,81.22,79.16,63.79,57.93,18.06,12.86,442.76,152.64
2004,137.74,81.81,82.61,64.68,59.97,18.12,13.74,458.67,156.51
2005,144.57,85.09,86.03,66.15,54.59,18.96,14.82,470.21,154.52
2006,148.11,90.28,88.55,68.23,48.00,20.38,15.31,478.86,151.92
2007,150.73,97.04,90.50,68.27,42.60,21.08,15.55,485.77,147.50
2008,155.67,100.87,92.99,69.91,38.92,21.97,15.84,496.17,146.64
2009,158.18,104.73,94.74,70.60,38.50,22.48,16.21,505.44,147.79
2010,163.07,110.02,97.75,74.40,40.11,23.20,16.83,525.38,154.54
2011,172.18,116.41,101.57,78.10,43.59,24.50,18.02,554.37,164.21
2012,177.33,124.96,109.72,83.26,47.96,26.29,19.81,589.33,177.32
2013,179.26,132.31,115.37,87.81,51.59,27.57,21.57,615.48,188.54
2014,177.94,138.32,118.40,93.95,56.13,28.95,22.23,635.92,201.26
2015,173.72,144.58,118.77,99.91,60.31,29.64,23.14,650.07,213.00
estimate_college_stem.py
#
#  Estimate the total production of STEM students at the
#  College level from BS degrees granted (United States)
#
#  (C) 2018 by John F. McGowan, Ph.D. (ceo@mathematical-software.com)
#

# Python standard libraries
import os
import sys
import time

# Numerical/Scientific Python libraries
import numpy as np
import scipy.optimize as opt  # curve_fit()
import pandas as pd  # reading text CSV files etc.

# Graphics
import matplotlib.pyplot as plt
import matplotlib.ticker as ticker
from mpl_toolkits.mplot3d import Axes3D

# customize fonts
SMALL_SIZE = 8
MEDIUM_SIZE = 10
LARGE_SIZE = 12
XL_SIZE = 14
XXL_SIZE = 16

plt.rc('font', size=XL_SIZE)          # controls default text sizes
plt.rc('axes', titlesize=XL_SIZE)     # fontsize of the axes title
plt.rc('axes', labelsize=XL_SIZE)     # fontsize of the x and y labels
plt.rc('xtick', labelsize=XL_SIZE)    # fontsize of the tick labels
plt.rc('ytick', labelsize=XL_SIZE)    # fontsize of the tick labels
plt.rc('legend', fontsize=XL_SIZE)    # legend fontsize
plt.rc('figure', titlesize=XL_SIZE)   # fontsize of the figure title

# STEM Bachelors Degrees earned by year (about 2000 to 2015)
#
# data from National Science Foundation (NSF)/ National Science Board
# Science and Engineering Indicators 2018 Report
# https://www.nsf.gov/statistics/2018/nsb20181/
# Figure 02-10
#
input_file = "STEM Degrees with Totals.csv"

if len(sys.argv) > 1:
    index = 1
    while index < len(sys.argv):
        if sys.argv[index] in ["-i", "-input"]:
            input_file = sys.argv[index+1]
            index += 1
        elif sys.argv[index] in ["-h", "--help", "-help", "-?"]:
            print("Usage:", sys.argv[0], " -i input_file='AP Calculus Totals by Year.csv'")
            sys.exit(0)
        index +=1

print(__file__, "started", time.ctime())  # time stamp
print("Processing data from: ", input_file)

# read text CSV file (exported from spreadsheet)
df = pd.read_csv(input_file)

# drop NaNs for missing values in Pandas
df.dropna()

# get number of students who pass AP Calculus Exam (AB or BC)
# each year
df_ap_pass = pd.read_csv("AP Calculus Totals.csv")
ap_year = df_ap_pass.values[:,0]
ap_total = df_ap_pass.values[:,1]

# numerical data
hard_stem_str = df.values[1:,-1] # engineering, physical sciences, math/stat, CS
all_stem_str = df.values[1:,-2]  # includes social science, psychology, agriculture etc.

hard_stem = np.zeros(hard_stem_str.shape)
all_stem = np.zeros(all_stem_str.shape)

for index, val in enumerate(hard_stem_str.ravel()):
    if isinstance(val, str):
        hard_stem[index] = np.float(val.replace(',',''))
    elif isinstance(val, (float, np.float)):
        hard_stem[index] = val
    else:
        raise TypeError("unsupported type " + str(type(val)))

for index, val in enumerate(all_stem_str.ravel()):
    if isinstance(val, str):
        all_stem[index] = np.float(val.replace(',', ''))
    elif isinstance(val, (float, np.float)):
        all_stem[index] = val
    else:
        raise TypeError("unsupported type " + str(type(val)))

DEGREES_PER_UNIT = 1000
# units are thousands of degrees granted
all_stem = DEGREES_PER_UNIT*all_stem
hard_stem = DEGREES_PER_UNIT*hard_stem

years_str = df.values[1:,0]
years = np.zeros(years_str.shape)
for index, val in enumerate(years_str.ravel()):
    years[index] = np.float(val)

# almost everyone in the labor force graduated since 1970
# someone 18 years old in 1970 is 66 today (2018)
START_YEAR = 1970

def my_exp(x, *p):
    """
    exponential model for curve_fit(...)
    """
    return p[0]*np.exp(p[1]*(x - START_YEAR))

# starting guess for model parameters
p_start = [ 50000.0, 0.01 ]

# fit all STEM degree data
popt, pcov = opt.curve_fit(my_exp, years, all_stem, p_start)

# fit hard STEM degree data
popt_hard_stem, pcov_hard_stem = opt.curve_fit(my_exp, \
                                               years, \
                                               hard_stem, \
                                               p_start)
# fit AP Students data
popt_ap, pcov_ap = opt.curve_fit(my_exp, \
                                 ap_year, \
                                 ap_total, \
                                 p_start)

print(popt)  # sanity check

STOP_YEAR = 2016
NYEARS = (STOP_YEAR - START_YEAR + 1)

years_fit = np.linspace(START_YEAR, STOP_YEAR, NYEARS)
n_fit = my_exp(years_fit, *popt)

n_pred = my_exp(years, *popt)

r2 = 1.0 - (n_pred - all_stem).var()/all_stem.var()
r2_str = "%4.3f" % r2

n_fit_hard = my_exp(years_fit, *popt_hard_stem)
n_pred_hard = my_exp(years, *popt_hard_stem)

r2_hard = 1.0 - (n_pred_hard - hard_stem).var()/hard_stem.var()
r2_hard_str = "%4.3f" % r2_hard

n_fit_ap = my_exp(years_fit, *popt_ap)
n_pred_ap = my_exp(ap_year, *popt_ap)

r2_ap = 1.0 - (n_pred_ap - ap_total).var()/ap_total.var()
r2_ap_str = "%4.3f" % r2_ap


cum_all_stem = n_fit.sum()
cum_hard_stem = n_fit_hard.sum()
cum_ap_stem = n_fit_ap.sum()

# to match BLS projections
future_years = np.linspace(2016, 2026, 11)

assert future_years.size == 11  # sanity check

future_students = my_exp(future_years, *popt)
future_students_hard = my_exp(future_years, *popt_hard_stem)
future_students_ap = my_exp(future_years, *popt_ap)

# https://fas.org/sgp/crs/misc/R43061.pdf
#
# The U.S. Science and Engineering Workforce: Recent, Current,
# and Projected Employment, Wages, and Unemployment
#
# by John F. Sargent Jr.
# Specialist in Science and Technology Policy
# November 2, 2017
#
# Congressional Research Service 7-5700 www.crs.gov R43061
#
# "In 2016, there were 6.9 million scientists and engineers (as
# defined in this report) employed in the United States, accounting
# for 4.9 % of total U.S. employment."
#

# BLS astonishing/bizarre projections for 2016-2026

# "The Bureau of Labor Statistics (BLS) projects that the number of S&E
# jobs will grow by 853,600 between 2016 and 2026 , a growth rate
# (1.1 % CAGR) that is somewhat faster than that of the overall
# workforce ( 0.7 %). In addition, BLS projects that 5.179 million
# scientists and engineers will be needed due to labor force exits and
# occupational transfers (referred to collectively as occupational
# separations ). BLS projects the total number of openings in S&E due to growth ,
# labor force exits, and occupational transfers between 2016 and 2026 to be
# 6.033 million, including 3.477 million in the computer occupations and
# 1.265 million in the engineering occupations."

# NOTE: This appears to project 5.170/6.9 or 75 percent!!!! of current STEM
# labor force LEAVE THE STEM PROFESSIONS by 2026!!!!

# "{:,}".format(value) to specify the comma separated thousands format
#
print("TOTAL Scientists and Engineers 2016:", "{:,.0f}".format(6.9e6))
# ALL STEM
print("\nALL STEM Bachelor's Degrees")
print("ESTIMATED TOTAL IN 2016 SINCE ", START_YEAR, ": ", \
      "{:,.0f}".format(cum_all_stem), sep='')
# don't use comma grouping for years
print("TOTAL FROM", "{:.0f}".format(years_str[0]), \
      "to 2015 (Science and Engineering Indicators 2018) ", \
      "{:,.0f}".format(all_stem.sum()))
print("ESTIMATED FUTURE STUDENTS (2016 to 2026):", \
      "{:,.0f}".format(future_students.sum()))
# annual growth rate of students taking AP Calculus
growth_rate_pct = (np.exp(popt[1]) - 1.0)*100

print("ANNUAL GROWTH RATE: ", "{:,.2f}".format(growth_rate_pct), \
      "%  US POPULATION GROWTH RATE (2016): 0.7 %")

# HARD STEM

print("\nHARD STEM DEGREES ONLY (Engineering, Physical Sciences, Math, CS)")
print("ESTIMATED TOTAL IN 2016 SINCE ", START_YEAR, ": ", \
      "{:,.0f}".format(cum_hard_stem), sep='')
# don't use comma grouping for years
print("TOTAL FROM", "{:.0f}".format(years_str[0]), \
      "to 2015 (Science and Engineering Indicators 2018) ", \
      "{:,.0f}".format(hard_stem.sum()))
print("ESTIMATED FUTURE STUDENTS (2016 to 2026):", \
      "{:,.0f}".format(future_students_hard.sum()))
# annual growth rate of students taking AP Calculus
growth_rate_pct_hard = (np.exp(popt_hard_stem[1]) - 1.0)*100

print("ANNUAL GROWTH RATE: ", "{:,.2f}".format(growth_rate_pct_hard), \
      "%  US POPULATION GROWTH RATE (2016): 0.7 %")


# AP STEM -- Students passing AP Calculus Exam Each Year

print("\nSTUDENTS PASSING AP CALCULUS EXAM")
print("ESTIMATED TOTAL IN 2016 SINCE ", START_YEAR, ": ", \
      "{:,.0f}".format(cum_ap_stem), sep='')
# don't use comma grouping for years
print("TOTAL FROM", "{:.0f}".format(ap_year[-1]), \
      "to", "{:.0f}".format(ap_year[0])," (College Board) ", \
      "{:,.0f}".format(ap_total.sum()))
print("ESTIMATED FUTURE STUDENTS (2016 to 2026):", \
      "{:,.0f}".format(future_students_ap.sum()))
# annual growth rate of students taking AP Calculus
growth_rate_pct_ap = (np.exp(popt_ap[1]) - 1.0)*100

print("ANNUAL GROWTH RATE: ", "{:,.2f}".format(growth_rate_pct_ap), \
      "%  US POPULATION GROWTH RATE (2016): 0.7 %")


# US Census reports 0.7 percent annual growth of US population in 2016
# SOURCE: https://www.census.gov/newsroom/press-releases/2016/cb16-214.html
#

f1 = plt.figure(figsize=(12,9))
ax = plt.gca()
# add commas to tick values (e.g. 1,000 instead of 1000)
ax.get_yaxis().set_major_formatter(
    ticker.FuncFormatter(lambda x, p: format(int(x), ',')))

DOT_COM_CRASH = 2000.25  # usually dated march 10, 2000
OCT_2008_CRASH = 2008.75 # usually dated October 11, 2008
DELTA_LABEL_YEARS = 0.5

plt.plot(years_fit, n_fit, 'g', linewidth=3, label='ALL STEM FIT')
plt.plot(years, all_stem, 'bs', markersize=10, label='ALL STEM DATA')
plt.plot(years_fit, n_fit_hard, 'r', linewidth=3, label='HARD STEM FIT')
plt.plot(years, hard_stem, 'ms', markersize=10, label='HARD STEM DATA')
plt.plot(years_fit, n_fit_ap, 'k', linewidth=3, label='AP STEM FIT')
plt.plot(ap_year, ap_total, 'cd', markersize=10, label='AP STEM DATA')
[ylow, yhigh] = plt.ylim()
dy = yhigh - ylow
# add marker lines for crashes
plt.plot((DOT_COM_CRASH, DOT_COM_CRASH), (ylow+0.1*dy, yhigh), 'b-')
plt.text(DOT_COM_CRASH + DELTA_LABEL_YEARS, 0.9*yhigh, '<-- DOT COM CRASH')
# plt.arrow(...) add arrow (arrow does not render correctly)

plt.plot((OCT_2008_CRASH, OCT_2008_CRASH), (ylow+0.1*dy, 0.8*yhigh), 'b-')
plt.text(OCT_2008_CRASH+DELTA_LABEL_YEARS, 0.5*yhigh, '<-- 2008 CRASH')
plt.legend()
plt.title('STUDENTS STEM BACHELORS DEGREES (ALL R**2=' \
          + r2_str + ',  HARD R**2=' + r2_hard_str + \
          ', AP R**2=' + r2_ap_str + ')')
plt.xlabel('YEAR')
plt.ylabel('TOTAL STEM BS DEGREES')
# appear to need to do this after the plots
# to get valid ranges
[xlow, xhigh] = plt.xlim()
[ylow, yhigh] = plt.ylim()
dx = xhigh - xlow
dy = yhigh - ylow
# put input data file name in lower right corner
plt.text(xlow + 0.65*dx, \
         ylow + 0.05*dy, \
         input_file, \
         bbox=dict(facecolor='red', alpha=0.2))

plt.show()

f1.savefig('College_STEM_Degrees.jpg')

print(__file__, "ALL DONE")
Many online web sites and services, including many that have useful information, have become highly distracting and addictive — wasting many hours of precious time and clouding our judgement leading to bad purchases and other critical decisions. This increasing level of distraction is probably due to a combination of increasing integration of persuasive technology and advances in recommendation engines and other algorithms.
I personally have had significant problems with lost time and distractions from YouTube and Hacker News. Both of these sites have useful information as well as large amounts of distracting dreck. I find both addictive. I substantially reduced the amount of time wasted on Hacker News by switching from the web site to the Hacker News RSS feed in my Thunderbird email program.
Hacker News Web Site
Below is the Hacker News RSS feed in Thunderbird.
Thunderbird RSS Hacker News Feed
Thunderbird has a feature to subscribe to and manage RSS feeds. As can be seen, I have subscribed to Hacker News and Slashdot. Although Slashdot is similar to Hacker News in a number of respects, I have consistently found Hacker News much more distracting and addictive.
There is also an “End of Month” folder. I have configured message filters in Thunderbird to move important but distracting articles from Hacker News and Slashdot to the “End of Month” folder. This includes for example articles on some political topics that tend to get my blood boiling.
Hacker News has a “social” system of user and article scores, upvotes, downvotes , comments and other decorations. This “socialization” of the new articles seems to be a major factor in why the web site is substantially more addictive and distracting than the RSS feed. In addition, as noted, I am able to filter out articles that tend to distract me, putting them aside for a planned time to deal with distracting topics.
Many web sites have RSS feeds including Hacker News, Slashdot, and Tech Crunch (not shown here). This method can be applied to many distracting web sites to reduce the unwanted distractions and lost time while still keeping up with useful information. Message Filters can be configured to delete dreck, set aside articles on important but distracting topics, and highlight articles of special interest. With message filters, you — the reader/user — are in control instead of mysterious machine learning algorithms and recommendation engines.
How to Set Up RSS in Thunderbird
The Thunderbird web site provides detailed instruction on how to set up a Feed Account and subscribe to RSS feeds here.
Step 1: Create a Feed Account
First you must create an account in Thunderbird for your feeds.
1. In the Menu Bar, click File > New > Feed Account. The Feed Account Wizard window appears.
2. Type a name for your Feed account in the Account Name box, then click Next.
3. Click Finish. Your new account will now appear in Thunderbird’s folder pane.
I gave my account the name Blogs and News Feeds:
Thunderbird RSS Blogs and News Feeds Account Example
There is a main dashboard for Blogs and News Feeds in Thunderbird:
Thunderbird RSS Dashboard
Click on Manage subscriptions to add an RSS feed. You will need the URL for the feed. The picture below shows the feed dialog in Thunderbird.
Thunderbird RSS Feed Dialog
How to set up message filters
Select the Message Filters menu item from the Tools drop down menu:
Thunderbird RSS Message Filters Menu Item
This brings up a dialog for creating and managing message filters:
Thunderbird RSS Message Filters Dialog
Click on the New button to create a new message filter. For example:
Thunderbird RSS Trump Filter Creation Example
The Distraction Economy
Smartphones and the Internet have become more and more distracting and addictive over the last several years with no signs of the trend reversing. This translates into many hours of lost time per week, month, and year. Even using the federal minimum wage of $7.25 per hour, five or ten hours per week lost to cat videos on YouTube, software industry gossip on Hacker News, or a million other online distractions translates into $36 to $72 per week, which is a lot for someone earning the minimum wage. Of course most readers of this article probably should value their time at $15 to $100 per hour.
A dollar estimate does not capture the lost real world social, personal, and professional opportunities. Outrage inducing videos and articles are often addictive but they are certainly not pleasant entertainment either.
Many of these distracting web sites, apps, and services seek to persuade us to buy products we don’t need, vote for public policies that don’t benefit us, and have other hidden costs that are difficult to measure — unlike lost time.
Many of these distracting web sites, apps, and services are also tightly integrated with a growing system of mass surveillance which, thanks to new technologies, is unprecedented in human history even in extreme dictatorships like Nazi Germany or Stalin’s Soviet Union. Extremely high bandwidth wireless networks, inexpensive high resolution video cameras, remarkable advances in video compression, huge disk drives, and ultra-fast computers have enabled levels of monitoring far beyond the dystopian future in George Orwell’s 1984.
Fears of terrorism and an implied Mad Max scenario of global economic collapse due to peak oil have contributed to a public acceptance of these highly questionable developments, along with shrewd marketing of social media and smartphones.
Waiting for companies obsessed with quarterly earnings and politicians beholden to wealthy campaign contributors to roll back or reform these developments is unlikely to work. People can take effective action — both individually and acting together — to reduce the level of distraction in their lives, regain valuable free time, and think more clearly, such as switching to RSS feeds and away from distracting web sites.
John F. McGowan, Ph.D. solves problems using mathematics and mathematical software, including developing gesture recognition for touch devices, video compression and speech recognition technologies. He has extensive experience developing software in C, C++, MATLAB, Python, Visual Basic and many other programming languages. He has been a Visiting Scholar at HP Labs developing computer vision algorithms and software for mobile devices. He has worked as a contractor at NASA Ames Research Center involved in the research and development of image and video processing algorithms and technology. He has published articles on the origin and evolution of life, the exploration of Mars (anticipating the discovery of methane on Mars), and cheap access to space. He has a Ph.D. in physics from the University of Illinois at Urbana-Champaign and a B.S. in physics from the California Institute of Technology (Caltech).
I recently switched from an aging Apple Macbook Air to a shiny new, substantially lighterLG gram running Windows 10. This involved switching from Apple Mail to the free open-source Mozilla Thunderbird. In principle, Apple Mail can export my address book (contacts) in the human-readable vcard or VCF, Virtual Contact File, format and Thunderbird can import an address book in vcard format. BUT, as it happens, Thunderbird failed to import the telephone numbers for my contacts, a long standing problem with Thunderbird.
Mozilla Thunderbird
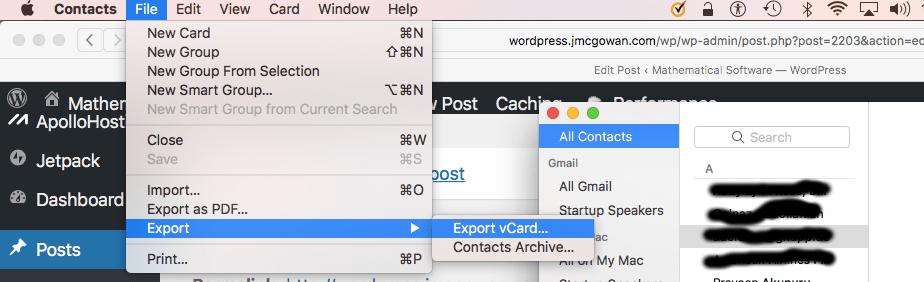
To export the Apple Mail contacts, bring up the Apple Contacts application, select All Contacts, and select File | Export | Export vCard…
Apple Contacts Export Closeup
Then save the vCard file:
Apple Contacts Save Dialog Box
To import the Apple Mail contacts with the phone numbers successfully, I wrote a Python 3 script to convert the VCF file to a comma separated values (CSV) file that Thunderbird could import with the phone numbers. I used Python 3.6.4 installed as part of the Anaconda Python distribution. Python and Anaconda are both available for Windows, Mac OS X, and most major flavors of the free open-source GNU/Linux operating system. In principle, the Python script should run correctly on any of these platforms.
By default the script (below) assumes the vcard file is named jfm_contacts.vcf and writes the Thunderbird compliant CSV to tbird_imports.vcf
To run the script using ipython (installed by Anaconda) and override these defaults:
C:\Users\John McGowan\Code>ipython
Python 3.6.4 |Anaconda, Inc.| (default, Jan 16 2018, 10:22:32) [MSC v.1900 64 bit (AMD64)]
Type 'copyright', 'credits' or 'license' for more information
IPython 6.2.1 -- An enhanced Interactive Python. Type '?' for help.

In [1]: run convert_vcf_to_csv.py mytest.vcf -o tbird_mytest.csv
Reading vcard (vcf) file:  mytest.vcf
WARNING: VCARD  19  ( Apple Inc. )  1-800-MY-APPLE  MAY NOT BE A VALID PHONE NUMBER
WARNING: VCARD  301  ( Name )  Mobile  MAY NOT BE A VALID PHONE NUMBER
WARNING: VCARD  301  ( Name )  Home  MAY NOT BE A VALID PHONE NUMBER
WARNING: VCARD  301  ( Name )  Work  MAY NOT BE A VALID PHONE NUMBER
WARNING: VCARD  301  ( Name )  Fax  MAY NOT BE A VALID PHONE NUMBER
Processed  503  vcards
Wrote Thunderbird Compliant CSV file with phone numbers to:  tbird_mytest.csv
ALL DONE
DISCLAIMER: Note that this script is provided “AS IS” (see license terms for more details). Giant corporations like Apple work long and hard to lock users into their “ecosystems” by, for example, using obfuscated non-standard “standard” formats for key contacts and other critical information stored in their products. Make sure to keep backups of your address books and contacts before using this script or similar software.
convert_vcf_to_csv.py
"""
convert Apple Mail VCF archive to CSV file for Mozilla Thunderbird (tbird)
tbird cannot read phone numbers from Apple Mail VCF file
"""

import sys
import os.path  # os.path.isfile(fname)
import re # regular expressions
import phone  # my phone number validation module

VERBOSE_FLAG = False  # debug trace flag

# CSV file header generated by exporting contacts from Mozilla Thunderbird 52.6.0
TBIRD_ADR_BOOK_HEADER = 'First Name,Last Name,Display Name,Nickname,Primary Email,Secondary Email,Screen Name,Work Phone,Home Phone,Fax Number,Pager Number,Mobile Number,Home Address,Home Address 2,Home City,Home State,Home ZipCode,Home Country,Work Address,Work Address 2,Work City,Work State,Work ZipCode,Work Country,Job Title,Department,Organization,Web Page 1,Web Page 2,Birth Year,Birth Month,Birth Day,Custom 1,Custom 2,Custom 3,Custom 4,Notes'  # was carriage return here

# John Nada from John Carpenter's THEY LIVE
DUMMY_CONTACT = 'John,Nada,John Nada,Nada,nada@nowhere.com,nada@cable54.com,NADA,999-555-1212,888-555-1234,777-555-6655,111-555-1234,111-555-9876,123 Main Street, Apt 13, Los Angeles, CA, 91210,USA,Work Address,Work Address 2,Work City,Work State,Work ZipCode,Work Country,Job Title,Department,Organization,Web Page 1,Web Page 2,Birth Year,Birth Month,Birth Day,Custom 1,Custom 2,Custom 3,Custom 4,Notes'

# break into values
FIELD_NAMES = TBIRD_ADR_BOOK_HEADER.split(',')
FIELD_VALUES_START = DUMMY_CONTACT.split(',')
for index, value in enumerate(FIELD_VALUES_START):
    FIELD_VALUES_START[index] = ''  # try single space

# build dictionary to map from field name to index
FIELD_INDEX = {}
for index, field_name in enumerate(FIELD_NAMES):
    FIELD_INDEX[field_name] = index

if VERBOSE_FLAG:
    print(FIELD_INDEX)

    print(TBIRD_ADR_BOOK_HEADER)
    print(DUMMY_CONTACT)


if len(sys.argv) < 2:
    VCARD_FILE = 'jfm_contacts.vcf'
else:
    VCARD_FILE = sys.argv[1]  # 0 is script name


def usage(cmd):
    """ usage message """
    print("Usage: ", cmd, "  [-license] [-o output_file.csv] ")
    print("   -- generate Thunderbird Compliant CSV file with importable telephone numbers ")
    print("   -- from Apple Mail generated .vcf (vcard) file")
    print("   -- (C) 2018 by John F. McGowan, Ph.D.")
    print("   ")
    print("   -license -- print license terms")
    print(" ")
    print("In Mozilla Thunderbird 52.6.0, Tools | Import | Address Books | Text file(LDIF,csv,tab,txt) | choose output file from this program.")
    print(" ")
    print("Tested with Python 3.6.4 installed by/with Anaconda")

def license_terms():
    """ license terms """
    license_msg = """Copyright 2018 John F. McGowan, Ph.D.

Redistribution and use in source and binary forms, with or without modification, are permitted provided that the following conditions are met:

1. Redistributions of source code must retain the above copyright notice, this list of conditions and the following disclaimer.

2. Redistributions in binary form must reproduce the above copyright notice, this list of conditions and the following disclaimer in the documentation and/or other materials provided with the distribution.

THIS SOFTWARE IS PROVIDED BY THE COPYRIGHT HOLDERS AND CONTRIBUTORS "AS IS" AND ANY EXPRESS OR IMPLIED WARRANTIES, INCLUDING, BUT NOT LIMITED TO, THE IMPLIED WARRANTIES OF MERCHANTABILITY AND FITNESS FOR A PARTICULAR PURPOSE ARE DISCLAIMED. IN NO EVENT SHALL THE COPYRIGHT HOLDER OR CONTRIBUTORS BE LIABLE FOR ANY DIRECT, INDIRECT, INCIDENTAL, SPECIAL, EXEMPLARY, OR CONSEQUENTIAL DAMAGES (INCLUDING, BUT NOT LIMITED TO, PROCUREMENT OF SUBSTITUTE GOODS OR SERVICES; LOSS OF USE, DATA, OR PROFITS; OR BUSINESS INTERRUPTION) HOWEVER CAUSED AND ON ANY THEORY OF LIABILITY, WHETHER IN CONTRACT, STRICT LIABILITY, OR TORT (INCLUDING NEGLIGENCE OR OTHERWISE) ARISING IN ANY WAY OUT OF THE USE OF THIS SOFTWARE, EVEN IF ADVISED OF THE POSSIBILITY OF SUCH DAMAGE.
    """
    print(license_msg)

if VCARD_FILE == "--help" or VCARD_FILE == "-h"\
   or VCARD_FILE == "-help" or VCARD_FILE == "-?":
    usage(sys.argv[0])
    sys.exit(0)

if VCARD_FILE == "--license" or VCARD_FILE == "-license":
    license_terms()
    sys.exit(0)

OUTPUT_FILENAME = 'tbird_imports.csv'
OUTPUT_FLAG = False
for arg_index, argval in enumerate(sys.argv):
    if OUTPUT_FLAG:
        OUTPUT_FILENAME = argval
        OUTPUT_FLAG = False
    if argval == "-o":
        OUTPUT_FLAG = True


# write import file with one dummy contact (John Nada from THEY LIVE)
OUTPUT_FILE = open(OUTPUT_FILENAME, 'w')
OUTPUT_FILE.write(TBIRD_ADR_BOOK_HEADER)
OUTPUT_FILE.write('\n')
OUTPUT_FILE.write(DUMMY_CONTACT)
OUTPUT_FILE.write('\n')

COMMA_DELIM = r"\,"

VCARD_COUNT = 0
b_processing = False  # processing a vcard

# check if input file exists
if os.path.isfile(VCARD_FILE):
    print("Reading vcard (vcf) file: ", VCARD_FILE)
else:
    print("Input vcard (vcf) file ", VCARD_FILE, " does not exist (missing)!")
    sys.exit(0)

input_file = open(VCARD_FILE)
for line in input_file:
    values = line.split(':')
    if values[0] == 'BEGIN':
        if len(values) > 1:
            if values[1] == 'VCARD\n':
                VCARD_COUNT = VCARD_COUNT + 1
                b_processing = True
                FIELD_VALUES = FIELD_VALUES_START.copy()

    if b_processing:
        tag = values[0]
        if tag == 'END':  # reached end of vcard
            if VERBOSE_FLAG:
                print("END OF VCARD ", VCARD_COUNT)
            b_processing = False
            # process non-dummy contact
            if FIELD_VALUES[FIELD_INDEX['Display Name']] != FIELD_VALUES_START[FIELD_INDEX['Display Name']]:
                contact_record = ','.join(FIELD_VALUES)
                if VERBOSE_FLAG:
                    print(contact_record)
                OUTPUT_FILE.write(contact_record)
                OUTPUT_FILE.write('\n')

        # parse info for the contact
        if tag == 'N':
            contact_name = values[1].strip().replace(';', ' ')
            if COMMA_DELIM in contact_name:
                contact_name = contact_name.split(COMMA_DELIM)[0]
            if isinstance(contact_name, str):
                name_parts = contact_name.split()
                if len(name_parts) > 1:
                    contact_first_name = name_parts[1]
                    contact_last_name = name_parts[0]
                else:
                    contact_first_name = ''
                    contact_last_name = ''
                FIELD_VALUES[FIELD_INDEX['First Name']] = contact_first_name
                FIELD_VALUES[FIELD_INDEX['Last Name']] = contact_last_name

        if tag == 'FN':  # FN (full name) is usually first_name last_name
            contact_fullname = values[1].strip().replace(';', ' ')
            if COMMA_DELIM in contact_fullname:
                contact_fullname = contact_fullname.split(COMMA_DELIM)[0]
            if isinstance(contact_fullname, str):
                FIELD_VALUES[FIELD_INDEX['Display Name']] = contact_fullname
                name_parts = contact_fullname.split()
                contact_first_name = name_parts[0]
                if len(name_parts) > 1:
                    contact_last_name = name_parts[1]
                else:
                    contact_last_name = ''
            else:
                contact_first_name = ''
                contact_last_name = ''
            FIELD_VALUES[FIELD_INDEX['First Name']] = contact_first_name
            FIELD_VALUES[FIELD_INDEX['Last Name']] = contact_last_name

            #print(contact_fullname)

        if tag == 'ORG':  # ORG (organization)
            contact_org = values[1].strip().replace(';', ' ')
            # Apple vcard uses semicolon as embedded delimiter
            FIELD_VALUES[FIELD_INDEX['Organization']] = contact_org

        if tag == 'NOTE': # NOTE (notes) in VCF
            contact_notes = values[1].strip().replace(r'\n', ' ')
            FIELD_VALUES[FIELD_INDEX['Notes']] = 'NOTE: ' + contact_notes

        if tag == 'TITLE':  # TITLE
            contact_title = values[1].strip()
            FIELD_VALUES[FIELD_INDEX['Job Title']] = 'TITLE: ' + contact_title

        if tag.startswith('EMAIL'):  #process emails
            contact_email = values[1].strip()
            FIELD_VALUES[FIELD_INDEX['Primary Email']] = contact_email

        if tag.startswith('TEL'):  # process phone numbers
            contact_phone = values[1].strip()
            # remove special characters and other noise
            contact_phone = re.sub('[^A-Za-z0-9() -]+', ' ', contact_phone)
            contact_phone = contact_phone.strip() # remove leading/trailing whitespace
            if not phone.is_valid_phone(contact_phone):
                print("WARNING: VCARD ", VCARD_COUNT, " (", contact_fullname, ") ", \
                      contact_phone, " MAY NOT BE A VALID PHONE NUMBER")

            if "HOME" in tag:
                FIELD_VALUES[FIELD_INDEX['Home Phone']] = contact_phone
            elif "WORK" in tag:
                FIELD_VALUES[FIELD_INDEX['Work Phone']] = contact_phone
            elif "MAIN" in tag:
                FIELD_VALUES[FIELD_INDEX['Work Phone']] = contact_phone
            elif "CELL" in tag:
                FIELD_VALUES[FIELD_INDEX['Mobile Number']] = contact_phone
            elif "OTHER" in tag:
                FIELD_VALUES[FIELD_INDEX['Custom 1']] = 'OTHER PHONE: ' + contact_phone
            else:
                FIELD_VALUES[FIELD_INDEX['Work Phone']] = contact_phone

        if tag.startswith('ADR'):  # physical addresses
            contact_address = values[1].strip().strip(';')
            contact_address = contact_address.replace(r'\n', ';')
            if "HOME" in tag:
                FIELD_VALUES[FIELD_INDEX['Home Address']] = contact_address
            elif "WORK" in tag:
                FIELD_VALUES[FIELD_INDEX['Work Address']] = contact_address
            elif "OTHER" in tag:
                FIELD_VALUES[FIELD_INDEX['Custom 2']] = 'OTHER ADDRESS: ' + contact_address
            else:
                FIELD_VALUES[FIELD_INDEX['Home Address']] = contact_address

        # just ^URL;....:url
        if tag.startswith('URL'):  # url
            contact_url = values[1].strip()
            index = FIELD_INDEX['Web Page 1']
            if not FIELD_VALUES[index]:
                FIELD_VALUES[index] = contact_url
            else:
                FIELD_VALUES[FIELD_INDEX['Web Page 2']] = contact_url

        if tag.startswith('item1.URL'):  # item1.URL...:https:remaining_url
            contact_url = ':'.join(values[1:])
            contact_url = contact_url.strip()
            if contact_url[:4] != 'http':
                contact_url = 'http://' + contact_url

            index = FIELD_INDEX['Web Page 1']
            if not FIELD_VALUES[index]:
                FIELD_VALUES[index] = contact_url
            else:
                FIELD_VALUES[FIELD_INDEX['Web Page 2']] = contact_url

        if tag.startswith('item2.URL'):  # item2.URL...:https:remaining_url
            contact_url = ':'.join(values[1:])
            contact_url = contact_url.strip()
            if contact_url[:4] != 'http':
                contact_url = 'http://' + contact_url

            index = FIELD_INDEX['Web Page 1']
            if not FIELD_VALUES[index]:
                FIELD_VALUES[index] = contact_url
            else:
                FIELD_VALUES[FIELD_INDEX['Web Page 2']] = contact_url

print("Processed ", VCARD_COUNT, " vcards")
OUTPUT_FILE.close()
print("Wrote Thunderbird Compliant CSV file with phone numbers to: ", OUTPUT_FILENAME)
print('ALL DONE')
convert_vcf_to_csv.py expects a module phone.py which contains code to check if a phone number is valid. The convert_vcf_to_csv.py script will print warning messages if it encounters a phone number that may be invalid although it still inserts the suspect phone number in the CSV file.
phone.py
'''
validate phone number module

(C) 2018 by John F. McGowan, Ph.D.

'''

import re

def is_valid_phone(phone_number):
    ''' determine if argument is a valid phone number '''
    result = re.match(r'\d?[ -]*(\d{3}|\(\d{3}\))?[ -]*\d{3}[- ]*\d{4}', phone_number)
    return bool(result != None)
Usage message
convert_vcf_to_csv.py --help
Usage:  convert_vcf_to_csv.py   [-license] [-o output_file.csv]
   -- generate Thunderbird Compliant CSV file with importable telephone numbers
   -- from Apple Mail generated .vcf (vcard) file
   -- (C) 2018 by John F. McGowan, Ph.D.

   -license -- print license terms

In Mozilla Thunderbird 52.6.0, Tools | Import | Address Books | Text file(LDIF,csv,tab,txt) | choose output file from this program.

Tested with Python 3.6.4 installed by/with Anaconda
By default, convert_vcf_to_csv.py writes an output file tbird_imports.csv which can be imported into the Thunderbird Address Book as follows:
(1) Bring up the Mozilla Thunderbird Address Book by clicking on the Address Bookbutton in Thunderbird:
Address Book Button in Thunderbird
(2) Select Tools | Import
Import Menu Item in Thunderbird Address Book
(3) This brings up an Importdialog. Select the Address Books option in the Importdialog.
Select Address Books Item in Import Dialog
(4) Select Nextbutton. This brings up a File Type Selection Dialog. Select Text File (LDIF, .tab, .csv, .txt)
Select Text File Type for Import
(5) Select Nextbutton. This brings up the Select address book filedialog. By default this displays and imports LDIF format address book. Select comma separated values (CSV) instead:
Select address book file dialog box
(6) Now open the Thunderbird compliant CSV file, default name tbird_imports.csv:
Open tbird_imports CSV file
(7) The new address book will now be imported into Mozilla Thunderbird complete with phone numbers. The new address book will appear in the list of address books displayed but the individual contacts may not be displayed immediately. Switch to another address book and back to see the new contacts or try searching for a new contact.
NOTE: Tested with Python 3.6.4 installed by Anaconda, Mozilla Thunderbird 52.6.0 on LG gram with Windows 10, and VCF contacts file exported from Apple Contacts Version 10.0 (1756.20) on a 13 inch Macbook Air (about 2014 vintage) running Mac OS X version 10.12.6 (macOS Sierra).
(C) 2018 by John F. McGowan, Ph.D.
About Me
John F. McGowan, Ph.D. solves problems using mathematics and mathematical software, including developing gesture recognition for touch devices, video compression and speech recognition technologies. He has extensive experience developing software in C, C++, MATLAB, Python, Visual Basic and many other programming languages. He has been a Visiting Scholar at HP Labs developing computer vision algorithms and software for mobile devices. He has worked as a contractor at NASA Ames Research Center involved in the research and development of image and video processing algorithms and technology. He has published articles on the origin and evolution of life, the exploration of Mars (anticipating the discovery of methane on Mars), and cheap access to space. He has a Ph.D. in physics from the University of Illinois at Urbana-Champaign and a B.S. in physics from the California Institute of Technology (Caltech).
I find Facebook useful for keeping in touch with friends and family that I can’t see in person regularly. I live in California and many of my relatives live on the East Coast of the United States. Similarly my busy life makes keeping in touch with some friends and acquaintances even in California in person difficult. However, Facebook became very distracting for me the last few years, primarily due to political posts during the 2016 Presidential election and even worse after Donald Trump won. I found Facebook was contributing heavily to distractions and wasted time.
Here are the steps that I have taken to largely eliminate the Facebook distractions in my life:
Remove the Facebook and Facebook Messenger apps from my smartphone entirely; only check Facebook on my laptop and desktop computers.
Configure my Facebook account to only send absolutely essential email and other notifications. No marketing or promotional notifications, no “someone liked this post” notifications, etc.
Install Matt Kruse’s Social Fixer add-on for Facebook and enable its’ built-in politics filter as well as add some custom filters for “Trump,” etc. I’ll say more about Social Fixer below.
Use SelfControl on the Mac and ColdTurkey on Windows to block Facebook entirely during my work day as well as sometimes at home.
Social Fixer
I have been using Social Fixer for about three months with a dramatic reduction in mostly political distracting posts. Social Fixer is a Javascript add on for Facebook available for both the Safari web browser on the Mac and the Firefox Web browser on a number of platforms. It comes with a built-in politics filter as well as user customizable filters and many other features to enable fine control over what Facebook shows you.
Social Fixer Web Site
The politics filter proved quite good although occasionally something will slip through. This enables me to keep in touch with friends who are freaking out over Trump (for example) or other hot button topics without being inundated with a continuous stream of distracting political posts.
Social Fixer Add On for Firefox
At least so far, I have found Social Fixer is a better option than unfollowing a friend on Facebook, where you lose all of their posts whether distracting (e.g. politics) or not.
Don’t Get Your News from Facebook
Facebook, YouTube and many other social media services appear to be using recently developed — we might say unproven, mostly untried — methods such as Deep Learning and Machine Learning to recommend, prioritize, and otherwise manage a wide range of posts, notably posts with political content. As I discussed in my previous post on reducing YouTube distractions, what these methods appear to do frequently is promote posts that generate strong often irrational instinctive reactions such as our “fight or flight” response. This often overrides our higher cognitive function which we need to use for most (not all) political issues. If you really care about politics or humanity, as I do, you want to avoid this sort of content so that you can think calmly and rationally about important issues.
Set aside some time each day or week depending on your schedule when you are calm and collected to study current events and the issues dispassionately.
Avoid your “Ideological Echo Chamber.” Identify a range of web sites or other sources that discuss the issues deeply and carefully from many points of view, not just your own. If you are a conservative, you should be following at least a few liberal and left-wing sources. If you are a liberal, you should be following at least a few conservative and right-wing sources. You should also be following some “fringe” sources that don’t fit neatly into the traditional right-left paradigm.
Fact-check and check the context of quotes and “facts” on all sides. A genuine fact can be highly misleading if other facts are omitted. Search engines such as Google and other Internet services make this much easier than years ago, when access to a top-notch library was generally needed.
Remember that Wikipedia is not reliable on “controversial” subjects. There are many examples of interest groups and activists capturing Wikipedia pages or bogging them down in flame wars.
Wherever possible use primary sources: read the actual memo, watch the unedited long form video, etc. Wikipedia is not a primary source.
Consider finding or organizing a dedicated forum — online or real-world — to share your concerns with friends, neighbors, colleagues and others rather than broadcasting your concerns with posts on Facebook or other general purpose social media platforms.
Conclusion
In my experience, it is possible to largely eliminate the distractions from Facebook using these methods:
Remove the Facebook and Facebook Messenger apps from my smartphone entirely; only check Facebook on my laptop and desktop computers.
Configure my Facebook account to only send absolutely essential email and other notifications. No marketing or promotional notifications, no “someone liked this post” notifications, etc.
Install Matt Kruse’s Social Fixer add-on for Facebook and enable its’ built-in politics filter as well as add some custom filters for “Trump,” etc.
Use SelfControl on the Mac and ColdTurkey on Windows to block Facebook entirely during my work day as well as sometimes at home.
(C) 2018 by John F. McGowan, Ph.D.
About the author
John F. McGowan, Ph.D. solves problems using mathematics and mathematical software, including developing gesture recognition for touch devices, video compression and speech recognition technologies. He has extensive experience developing software in C, C++, MATLAB, Python, Visual Basic and many other programming languages. He has been a Visiting Scholar at HP Labs developing computer vision algorithms and software for mobile devices. He has worked as a contractor at NASA Ames Research Center involved in the research and development of image and video processing algorithms and technology. He has published articles on the origin and evolution of life, the exploration of Mars (anticipating the discovery of methane on Mars), and cheap access to space. He has a Ph.D. in physics from the University of Illinois at Urbana-Champaign and a B.S. in physics from the California Institute of Technology (Caltech).