The Myth of Falsifiability Article

NOTE: This is an updated version of my presentation “The Myth of Falsifiability.” I have added a few comments on the application of falsifiability and falsifiability metrics to models of the COVID-19 pandemic. The main focus is on the safety and effectiveness of drugs and medical treatments and financial models of investments, but the relevance to COVID-19 models should be obvious. A video version of this presentation is available at https://youtu.be/6y6_6x_kmlY

The article starts with a discussion of the myth of falsifiability, a commonly cited doctrine often used to exclude certain points of view and evidence from consideration as “not scientific”. It discusses the glaring problems with the popular versions of this doctrine and the lack of a rigorous quantitative formulation of a more nuanced concept of falsifiability as originally proposed, but not developed, by the philosopher Karl Popper. The article concludes with a brief accessible presentation of our work on a rigorous quantitative falsifiability metric useful in practical science and engineering.

The scientific doctrine of falsifiability is key in practical problems such as confirming the accuracy and reliability of epidemiological models of the COVID-19 pandemic, the safety and effectiveness of pharmaceuticals and the safety and the reliability of financial models. How confident can we be of unprecedented world-changing policies ostensibly based on a plethora of conflicting models of the COVID-19 pandemic combined with highly incomplete and rapidly changing data?

How confident can we be that FDA approved drugs are safe, let alone effective? How confident can we be of AAA ratings for securities based on mathematical models?

In practice falsifiability is commonly cited to exclude certain points of view and evidence from consideration as “not scientific”.

The Encyclopedia Brittanica gives a typical example of the popular version of falsifiability:

Criterion of falsifiability, in the philosophy of science, a standard of evaluation of putatively scientific theories, according to which a theory is genuinely scientific only if it is possible in principle to establish that it is false.

Encyclopedia Brittanica

In practice, this popular version of falsifiability gives little guidance in evaluating whether an epidemiological model is reliable, a drug is safe or effective or a triple-A rated security is genuinely low risk. In actual scientific and engineering practice, we need a reliable estimate of how likely the apparent agreement of model and data is due to flexibility in the model from adjustable parameters, ad hoc changes to the mathematical model, and other causes such as data selection procedures. I will discuss this in more detail later in this article.

Karl Popper and The Logic of Scientific Discovery

The Austrian philosopher Karl Popper developed and presented a theory of falsifiability in his book The Logic of Scientific Discovery. This book is often cited and rarely read. My copy is 480 pages of small type.

Popper was especially concerned with rebutting the ostensibly scientific claims of Marxism and other ideologies. Popper was a deep thinker and understood that there were problems with a simple concept of falsifiability as I discuss next.

Falsifiability is largely encountered in disputes about religion and so-called pseudo-science, for example parapsychology. It is notably common in disputes over teaching evolution and creationism, the notion that God created the universe, life and human beings in some way, in schools. In the United States, creationism often refers to a literal or nearly literal interpretation of the Book of Genesis in the Bible.

This is a typical example from the RationalWiki arguing that creationism is not falsifiable and therefore is not science.

RationalWiki Example of the Common Use of Falsifiability

Remarkably, the doctrine of falsifiability is very rarely invoked in the scholarly scientific peer-reviewed literature, almost never outside of rare articles specifically rebutting the legitimacy of topics such as creationism and alleged pseudo-science. For example, a search of the arxiv.org preprint archive (1.6 million articles) turned up only eight matches for falsifiability and Popper as shown here.

Scientific and Engineering Citation of Falsifiability is Extremely Rare

In fact, there are many historical examples of scientific theories that could not be falsified but have been confirmed.

The existence of Black Swans, discovered in Australia. No matter how long one fails to find a single black swan, this does not mean they do not exist.

Stones falling from the sky, meteorites, were rejected by science for over a century despite many historical and anecdotal accounts of these remarkable objects.

Images of a Black Swan and a Meteorite
A Black Swan and a Meteorite

What experiment could we reasonably now perform that would falsify the existence of black swans and meteorites? Does this mean they are not scientific even though they exist?

The Hebrew Bible

Divine creation of the world and the existence of God are both examples of propositions that are impossible to falsify or disprove, but they can be almost completely verified by evidence that would be accepted by nearly all people as almost conclusive.

For example if we were to discover the Hebrew text of the Bible encoded in a clear way in the DNA of human beings, this would be strong – not absolutely conclusive – evidence for divine creation.

If the Sun were to stop in its course for an hour tomorrow and a voice boom out from the Heavens: “This is God. I created the world and human beings. Make love not war.” this would be reasonably accepted as nearly conclusive evidence of God and creation.

The Matrix: The World is a Computer Simulation

Of course, any evidence for God or any other remarkable or unexpected phenomenon can be explained by invoking other extreme possibilities such as time travel, super-advanced space aliens or inter-dimensional visitors, or a computer simulation reality as in The Matrix movie.

I am not endorsing any religion or divine creation in making this point. I am simply pointing out the deep flaws in the doctrine of falsifiability as generally invoked.

Fritz Zwicky and the Velocity Curves for the Triangulum Galaxy (Messier 33 or M33)

Let’s leave the world of religion and theology behind and take a look at the problems with falsifiability in mainstream scientific cosmology including the scientific account of creation, the Big Bang Theory.

In the 1930’s Fritz Zwicky, shown on the left, an astronomer at the California Institute of Technology (Caltech) noticed that the velocities of the orbit of stars in our Galaxy, the Milky Way, around the Galactic Center failed to decline with distance from the Galactic Center as predicted by both Newton’s theory of gravity and Einstein’s more recent General Theory of Relativity.

The plot on the right shows a similar dramatic discrepancy in a nearby galaxy, the Triangulum Galaxy, also known as Messier 33 (M33).

These observations would appear to falsify both Newton and Einstein’s theories of gravity in a dramatic way. Did scientists forthrightly falsify these theories as RationalWiki and other popular version of falsifiability claim they would?

NO. They did not. Instead they postulated a mysterious “dark matter” that could not be observed that fixed the gross discrepancy between theory and experiment.

In the last century, numerous additional discrepancies at the larger scales of clusters and super-clusters of galaxies have been observed, leading to the introduction of additional types of dark matter to get the theory to match the observations. None of these hypothetical dark matter candidates have ever been observed despite many searches.

Hubble Space Telescope

Einstein’s General Theory of Relativity originally included an additional term, usually known as the cosmological constant, to prevent the expansion of the universe. Einstein is reported to have called this term his “greatest blunder” after observations by Edwin Hubble showed otherwise unexplained extragalactic redshifts that could be explained as caused by the expansion of the universe, what is now called the Big Bang Theory.

The observation of the red shifts appeared to falsify Einstein’s theory. Einstein quickly dropped the cosmological constant term, achieving agreement with the data.

The Hubble Space Telescope discovered evidence that the expansion of the universe was accelerating, something the General Theory of Relativity failed to predict.

The Cosmological Term

Did scientists falsify the General Theory at this point? NO. Einstein had chosen the value of the cosmological constant to exactly balance the predicted expansion which initially contradicted known observations and theoretical prejudices. By using a different cosmological constant, modern scientists could reproduce the acceleration found by the Hubble.

Einstein, right even when he was wrong! Modern cosmologists attribute the non-zero cosmological constant to a mysterious dark energy permeating the universe. So far the dark energy, like the dark matter before it, has never been directly observed.

The modern Big Bang Theory incorporates other as yet unobserved entities such as “inflation” as well.

The Martian Epicycle

In practice, it is almost always possible to salvage a scientific theory by postulating undetected and perhaps unmeasurable entities such as dark matter, dark energy, inflation, and the original Ptolemaic epicycles.

In the Ptolemaic Earth-centered solar system Mars orbits the Earth. Mars is observed to back up in the Zodiac for about two months every two years. This clearly contradicted the Earth-centered model. This gross discrepancy was largely fixed by introducing an epicycle in which Mars orbits an invisible point which in turn orbits the Earth as shown in the plot on the right. The ancients interpreted Mars as a god or angel and justified the epicycles as complex dance moves dictated by the king of the gods or a monotheistic God.

In mathematical terms, a rigorous quantitative theory such as the General Theory of Relativity or Newton’s Theory of Gravity is a mathematical formula or expression. Discrepancies between these theories and observation can be resolved by adding, subtracting, or modifying different terms in the formula, such as the cosmological constant term. These modified terms often correspond to hypothetical entities such as dark energy.

MOND Alternative to General Relativity with Dark Matter

Many alternative theories to general relativity exist. MOND or Modified Newtonian Dynamics is the leading competitor at the moment. It can explain many (not all) observations without resorting to unobserved dark matter.

In fact, many complex mathematical theories such as those produced by modern machine learning and deep learning methods can “explain” the observations in scientific cosmology.

This is not surprising because complex theories with many adjustable parameters like the cosmological constant are plastic and can fit a wide range of data, in extreme cases like saran wrap can fit almost any solid surface.

A simple example of this saran wrap like behavior of complex mathematical formulae is the Taylor polynomial. A Taylor polynomial with enough terms can approximate almost any function arbitrarily well.

The Fourth (4th) Degree Taylor Polynomial Fitted to Periodic Data

The plot here shows a Taylor polynomial approximating a periodic function, the trigonometric sine, better and better as the degree, number of terms, increases.

Sixth (6th) Degree Taylor Polynomial Fitted to the Same Periodic Data
Eighth (8th) Degree Taylor Polynomial Fitted to the Same Periodic Data
Tenth (10th) Degree Taylor Polynomial Fitted to the Same Periodic Data
All the Taylor Polynomial Models (Degrees 4,6,8, and 10) and Data in One Plot

The region of interest (ROI), containing the data used in the fit, is the region between the red triangle on the left and the red triangle on the right.

Notice the agreement with the data in the Region of Interest improves as the degree, the number of terms, increases. R SQUARED is roughly the fraction of the data explained by the model. Notice also the agreement for the Taylor Polynomial actually worsens outside the Region of Interest as the number of terms increases.

In general the Taylor Polynomial will predict new data within the Region of Interest well but new data outside the ROI poorly.

If agreement is poor, simply add more terms – like the cosmological constant – until agreement is acceptable.

This is why the Ptolemaic theory of planetary motion with epicycles could not be falsified.

Falsifiability Metric Table for Cosmology

Is Scientific Cosmology Falsifiable?

In real scientific practice, falsifiability is too vaguely defined and is not quantitative.

Falsifiability is not a simple binary, yes or no criterion in actual practice.
Rather some theories are highly plastic and difficult to falsify. Some are less plastic, stiffer and easier to falsify. Falsifiability or plasticity is a continuum, not a simple binary yes or no, 0 or 1.0.

Falsifiability in Drug Approvals

Nonetheless, the question of falsifiability is of great practical importance. For example, many drugs are advertised as scientifically proven or strongly implied to be scientifically proven to reduce the risk of heart attacks and extend life, to slow the progression of cancer and extend life for cancer patients, and to effectively treat a range of psychological disorders such as paranoid schizophrenia, clinical depression, and Attention Deficit Hyperactivity Disorder (ADHD).

All of these claims have been questioned by a minority of highly qualified medical doctors, scientists, and investigative reporters.

Are these claims falsifiable? If not, are they therefore not scientific? How sure can we be that these drugs work? Does the doctrine of falsifiability give any insight into these critical questions?

Somehow we need to adjust the seeming agreement of models with data for the plasticity of the models – their ability to fit a wide range of data sets due to complexity.

Falsifiability in Drug Approvals

In Pharmaceutical Drug Approvals, the scientific theory being tested is that a drug is both safe and effective. Can erroneous claims of safety or effectiveness by pharmaceutical companies be falsified – not always it seems.

In the VIOXX scandal, involving a new pain reliever, marketed as a much more expensive super-aspirin that was safer than aspirin and other traditional pain relievers which can cause sometimes fatal gastrointestinal bleeding after prolonged use, scientists omitted several heart attacks, strokes, and deaths from the reported tallies for the treatment group.

This omission is similar to omitting the cosmological constant term in General Relativity. Indeed the ad hoc assumptions used to omit the injuries and deaths could be expressed mathematically as additional terms in a mathematical model of mortality as a function of drug dose.

Surveys of patients treated with VIOXX after approval showed higher heart attack, stroke, and death rates than patients treated with traditional pain relievers. Merck was nearly bankrupted by lawsuit settlements.

Vioxx: The Killer Pain Reliever Safer Than Aspirin
Merck Withdraws Vioxx from Market in 2004
Merck Stock Drops

Falsifiability in Financial Risk Models

Falsifiability of Financial Risk Models

Moving from the world of drug risks to finance: the 2008 housing and financial crash was caused in part by reliance on financial risk models that underestimated the risk of home price declines and mortgage defaults.

Many of these models roughly assumed the popular Bell Curve, also known as the Normal or Gaussian distribution. The Bell Curve is frequently used in grading school work. It also tends to underestimate the risk of financial investments.

Are financial models falsifiable? Not always it seems.

Falsifiability of Coronavirus COVID-19 Pandemic Models

The public response to the current (April 12, 2020) Coronavirus COVID-19 Pandemic has been shaped by frequently complex, sometimes contradictory, and changing epidemiological models such as the widely cited Imperial College Model from the group headed by Professor Nell Ferguson as well as a competing model from Oxford — and many other models as well. There has been considerable well-justified controversy and confusion over these models.

Can we “falsify” these models in the popular binary “yes” or “no” sense of falsifiability? They are certainly imperfect and have failed various predictions, hence various revisions. Many key parameters such as the actual mortality rate broken down by age, sex, race, pre-existing medical conditions, and other risk factors have not been measured. The Imperial College Model is reportedly quite complex and may well be very “plastic” (not very falsifiable).

In fact, all or most of the models have been “falsified” in the binary falsification sense in real time as they have made predictions that failed and have been revised in various ways. Obviously a more nuanced measure, such as the falsifiability metric discussed below, is needed to evaluate the reliability of the models and compare them.

Falsifiability in Math Recognition

This is an example of the falsifiability problem in our work at Mathematical Software. We have a large, growing database of known mathematics, functions such as the Bell Curve and the Cauchy-Lorenz function shown here. Our math recognition software identifies the best candidate mathematical models for the data from this database.

The math recognizer yields an ordered list of candidate models ranked by goodness of fit, in this example the coefficient of determination, loosely the percent of agreement with the data.

The plot is an analysis of some financial data. On the vertical axis we have the percent agreement of the model with the data, One hundred percent is perfect agreement. Technically the value on the vertical axis is the coefficient of determination, often referred to as R squared.

On the horizontal axis is the probability of getting a return on investment less than the risk free return, the return from investing in a Treasury bond, about two (2) percent per year. This probability varies dramatically from model to model. It is a key metric for investment decisions.

Our best model is the Cauchy-Lorenz model, beating out the popular Bell Curve. BUT, what if the Cauchy-Lorenz is more plastic (less falsifiable) than the Bell Curve? The better agreement may be spurious. The difference in risk is enormous! Cauchy-Lorenz means a high risk investment and the Bell Curve means a low risk investment.

This problem has been encountered many times in statistics, data analysis, artificial intelligence, and many other related fields. A wide variety of ad hoc attempts to solve it have been offered in the scientific and engineering literature. For example, there are many competing formula to correct the coefficient of determination R**2 (R SQUARED) but there does not appear to be a rigorous and/or generally accepted solution or method. These adjusted R**2 formulae included Wherry’s formula, McNemar’s formula, Lord’s formula, and Stein’s formula (see graphic below).

Various Ad Hoc Adjustments for the Flexibility of Mathematical Models

The formulae do not, for example, take into account that different functions with the same number of adjustable parameters can have different degrees of plasticity/falsifiability.

In many fields, only the raw coefficient of determination R**2 is reported.

A Prototype Falsifiability Metric

This is an example of a prototype falsifiability metric illustrated with the Taylor Polynomials.

The metric consists of an overall falsifiability measure for the function, the value F in the title of each plot, and a function or curve adjusting the raw goodness of fit, the coefficient of determination or R SQUARED in this case, for each model.

The plots show the Taylor Polynomial A times X + B in the upper left, the Taylor Polynomial A times X squared plus B times X + C in the upper right, the 6th degree Taylor Polynomial in the lower left, and the tenth degree Taylor Polynomial in the lower right.

The red marker shows the adjusted value of an R SQUARED value of 0.9 or ninety percent.

As terms are added to the model the falsifiability decreases. It is easier for the more complex models to fit data generated by other functions! The Taylor Polynomials of higher degree are more and more plastic. This is reflected in the decreasing value of the falsifiability metric F.

In addition, the goodness of fit metric, R SQUARED here, is adjusted to compensate for the higher raw values of R SQUARED that a less falsifiable, more plastic function yields. An unfalsifiable function will always give R SQUARED of 1.0, the extreme case .The adjusted R**2 enables us to compare the goodness of fit for models with different numbers of terms and parameters, different levels of falsifiability.

Conclusion

Conclusion Slide

In conclusion, a simple “yes” or “no” binary falsifiability as commonly defined (e.g. in the Encyclopedia Brittanica) does not hold up in real scientific and engineering practice. It is too vaguely defined and not quantitative. It also excludes scientific theories that can be verified but not ruled out. For example, in the present (April 12, 2020) crisis, it is clearly useless in evaluating the many competing COVID-19 pandemic models and their predictions.

Falsifiability does reflect an actual problem. Scientific and engineering models — whether verbal conceptual models or rigorous quantitative mathematical models — can be and often are flexible or plastic, able to match many different sets of data and in the worse case such as the Taylor Polynomials, essentially any data set. Goodness of fit statistics such as R**2 are boosted by this plasticity/flexibility of the models making evaluation of performance and comparison of models difficult or impossible at present.

A reliable quantitative measure is needed. What is the (presumably Bayesian) probability that the agreement between a model and data is due to this flexibility of the model as opposed to a genuine “understanding” of the data? We are developing such a practical falsifiability measure here at Mathematical Software.

(C) 2020 by John F. McGowan, Ph.D.

About Me

John F. McGowan, Ph.D. solves problems using mathematics and mathematical software, including developing gesture recognition for touch devices, video compression and speech recognition technologies. He has extensive experience developing software in C, C++, MATLAB, Python, Visual Basic and many other programming languages. He has been a Visiting Scholar at HP Labs developing computer vision algorithms and software for mobile devices. He has worked as a contractor at NASA Ames Research Center involved in the research and development of image and video processing algorithms and technology. He has published articles on the origin and evolution of life, the exploration of Mars (anticipating the discovery of methane on Mars), and cheap access to space. He has a Ph.D. in physics from the University of Illinois at Urbana-Champaign and a B.S. in physics from the California Institute of Technology (Caltech).

A Brief History of Virus Scares

A Brief History of Virus Scares

(C) 2020 by John F. McGowan, Ph.D.

About Me

John F. McGowan, Ph.D. solves problems using mathematics and mathematical software, including developing gesture recognition for touch devices, video compression and speech recognition technologies. He has extensive experience developing software in C, C++, MATLAB, Python, Visual Basic and many other programming languages. He has been a Visiting Scholar at HP Labs developing computer vision algorithms and software for mobile devices. He has worked as a contractor at NASA Ames Research Center involved in the research and development of image and video processing algorithms and technology. He has published articles on the origin and evolution of life, the exploration of Mars (anticipating the discovery of methane on Mars), and cheap access to space. He has a Ph.D. in physics from the University of Illinois at Urbana-Champaign and a B.S. in physics from the California Institute of Technology (Caltech).

Killer Halloween Candy!

A video about poisoned, contaminated, and boobytrapped Halloween candy, also known as Halloween Sadism, a widely reported and feared but thankfully quite rare occurrence. It discusses Professor Joel Best’s research on Halloween Sadism and also his research on questionable statistics that often accompany scary stories like poisoned Halloween candy.

Links: Joel Best’s Web Site: https://www.joelbest.net/

Support Us: PATREON: https://www.patreon.com/user?u=28764298

Credits: Jack O Lantern image is from Wikipedia and is in the public domain. https://commons.wikimedia.org/wiki/File:Balle-%C3%A0-leunettes_10.jpg

(C) 2020 by John F. McGowan, Ph.D.

About Me

John F. McGowan, Ph.D. solves problems using mathematics and mathematical software, including developing gesture recognition for touch devices, video compression and speech recognition technologies. He has extensive experience developing software in C, C++, MATLAB, Python, Visual Basic and many other programming languages. He has been a Visiting Scholar at HP Labs developing computer vision algorithms and software for mobile devices. He has worked as a contractor at NASA Ames Research Center involved in the research and development of image and video processing algorithms and technology. He has published articles on the origin and evolution of life, the exploration of Mars (anticipating the discovery of methane on Mars), and cheap access to space. He has a Ph.D. in physics from the University of Illinois at Urbana-Champaign and a B.S. in physics from the California Institute of Technology (Caltech).

The 1950’s Atomic Horror Professor (Video)

A short video about the portrayal of professors and scientists in 1950’s and early 1960’s “Atomic Horror” science fiction/horror movies.

(C) 2020 by John F. McGowan, Ph.D.

About Me

John F. McGowan, Ph.D. solves problems using mathematics and mathematical software, including developing gesture recognition for touch devices, video compression and speech recognition technologies. He has extensive experience developing software in C, C++, MATLAB, Python, Visual Basic and many other programming languages. He has been a Visiting Scholar at HP Labs developing computer vision algorithms and software for mobile devices. He has worked as a contractor at NASA Ames Research Center involved in the research and development of image and video processing algorithms and technology. He has published articles on the origin and evolution of life, the exploration of Mars (anticipating the discovery of methane on Mars), and cheap access to space. He has a Ph.D. in physics from the University of Illinois at Urbana-Champaign and a B.S. in physics from the California Institute of Technology (Caltech).

Vioxx: The Case of the Deadly Data Analysis [Video]

Vioxx: The Case of the Deadly Data Analysis (Video)

(C) 2020 by John F. McGowan, Ph.D.

About Me

John F. McGowan, Ph.D. solves problems using mathematics and mathematical software, including developing gesture recognition for touch devices, video compression and speech recognition technologies. He has extensive experience developing software in C, C++, MATLAB, Python, Visual Basic and many other programming languages. He has been a Visiting Scholar at HP Labs developing computer vision algorithms and software for mobile devices. He has worked as a contractor at NASA Ames Research Center involved in the research and development of image and video processing algorithms and technology. He has published articles on the origin and evolution of life, the exploration of Mars (anticipating the discovery of methane on Mars), and cheap access to space. He has a Ph.D. in physics from the University of Illinois at Urbana-Champaign and a B.S. in physics from the California Institute of Technology (Caltech).

Video: A Murder Over Mars?

Johannes Kepler, Tycho Brahe, and the planet Mars they quarreled over.
All About the Mysterious Death of Astronomer Tycho Brahe

(C) 2020 by John F. McGowan, Ph.D.

About Me

John F. McGowan, Ph.D. solves problems using mathematics and mathematical software, including developing gesture recognition for touch devices, video compression and speech recognition technologies. He has extensive experience developing software in C, C++, MATLAB, Python, Visual Basic and many other programming languages. He has been a Visiting Scholar at HP Labs developing computer vision algorithms and software for mobile devices. He has worked as a contractor at NASA Ames Research Center involved in the research and development of image and video processing algorithms and technology. He has published articles on the origin and evolution of life, the exploration of Mars (anticipating the discovery of methane on Mars), and cheap access to space. He has a Ph.D. in physics from the University of Illinois at Urbana-Champaign and a B.S. in physics from the California Institute of Technology (Caltech).

Hopewell Pre-Columbian Ruins in Ohio Video

Mound City Ruins in Chillicothe, Ohio
Short Video on Hopewell Culture Ruins in Ohion

This is a video about the Hopewell Culture Pre-Columbian ruins in Chillicothe, Ohio including what they are, maps and directions to reach them from the John Glenn International Airport in Columbus, Ohio, a slide show of the Mound City site ruins in Chillicothe, a comparison to the Cahokia ruins near St. Louis, and some discussion of what we can actually know about these two-thousand year old ruins.

(C) 2019 by John F. McGowan, Ph.D.

About Me

John F. McGowan, Ph.D. solves problems using mathematics and mathematical software, including developing gesture recognition for touch devices, video compression and speech recognition technologies. He has extensive experience developing software in C, C++, MATLAB, Python, Visual Basic and many other programming languages. He has been a Visiting Scholar at HP Labs developing computer vision algorithms and software for mobile devices. He has worked as a contractor at NASA Ames Research Center involved in the research and development of image and video processing algorithms and technology. He has published articles on the origin and evolution of life, the exploration of Mars (anticipating the discovery of methane on Mars), and cheap access to space. He has a Ph.D. in physics from the University of Illinois at Urbana-Champaign and a B.S. in physics from the California Institute of Technology (Caltech).

Was the Manhattan Project a Fluke?

Was the Manhattan Project a Fluke?

This video argues that the Manhattan Project which developed the first atomic bombs and nuclear reactors during World War II was a fluke, not representative of what can be accomplished with Big Science programs. There have been many failed New Manhattan Projects since World War II.

Minor Correction: Trinity, the first atomic bomb test, took place on July 16, 1945 — not in May of 1945 as stated in the audio.

(C) 2019 by John F. McGowan, Ph.D.

About Me

John F. McGowan, Ph.D. solves problems using mathematics and mathematical software, including developing gesture recognition for touch devices, video compression and speech recognition technologies. He has extensive experience developing software in C, C++, MATLAB, Python, Visual Basic and many other programming languages. He has been a Visiting Scholar at HP Labs developing computer vision algorithms and software for mobile devices. He has worked as a contractor at NASA Ames Research Center involved in the research and development of image and video processing algorithms and technology. He has published articles on the origin and evolution of life, the exploration of Mars (anticipating the discovery of methane on Mars), and cheap access to space. He has a Ph.D. in physics from the University of Illinois at Urbana-Champaign and a B.S. in physics from the California Institute of Technology (Caltech).
Another Skeptical Look at STEM Shortage Numbers

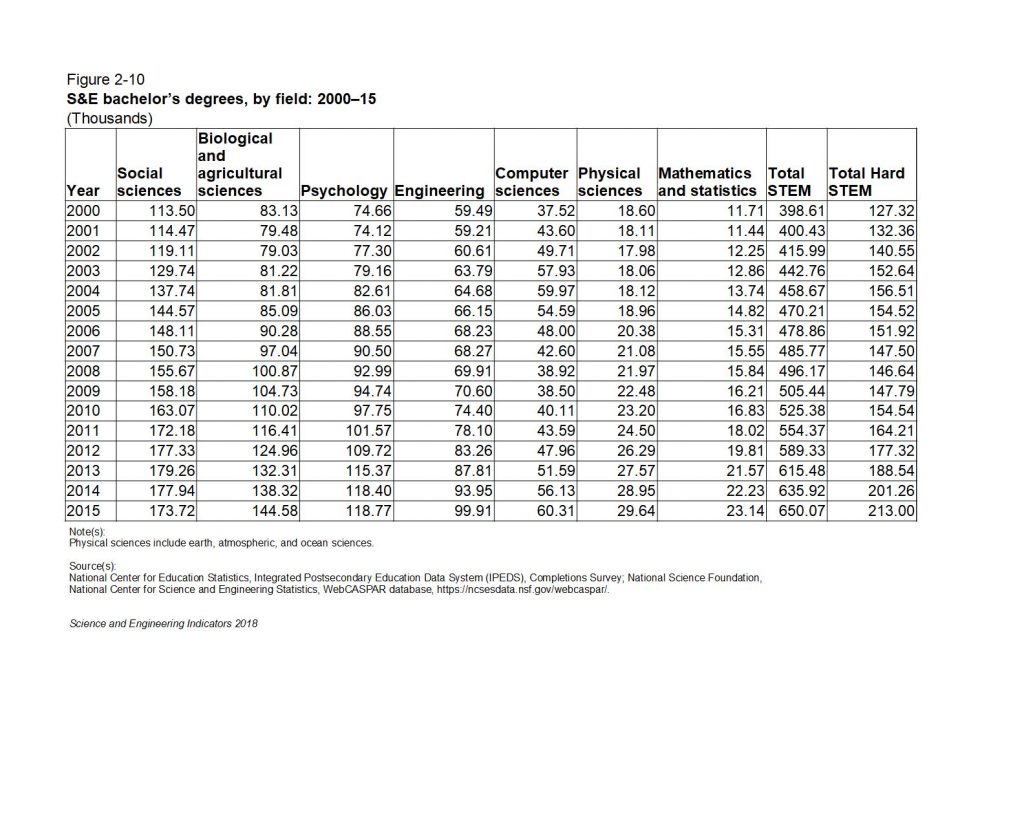
College STEM Degrees (NSF Science and Engineering Indicators 2018)

It is common to encounter claims of a “desperate” or “severe” shortage of STEM (Science, Technology, Engineering, and Mathematics) workers, either current or projected, usually from employers of STEM workers. These claims are perennial and date back at least to the 1940’s after World War II despite the huge number of STEM workers employed in wartime STEM projects (the Manhattan Project that developed the atomic bomb, military radar, code breaking machines and computers, the B-29 and other high tech bombers, the development of penicillin, K-rations, etc.). This article takes a look at the STEM degree numbers in the National Science Foundation’s Science and Engineering Indicators 2018 report.

College STEM Degrees (NSF Science and Engineering Indicators 2018)

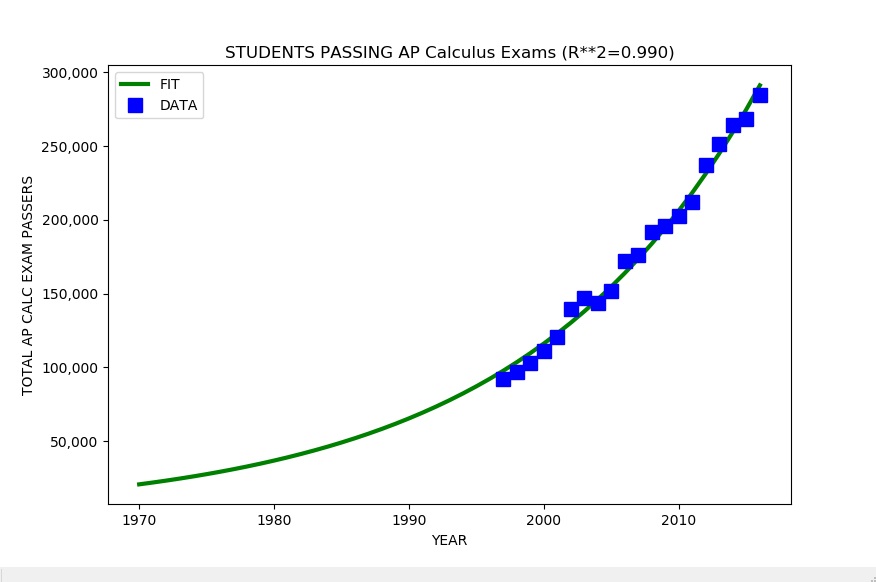
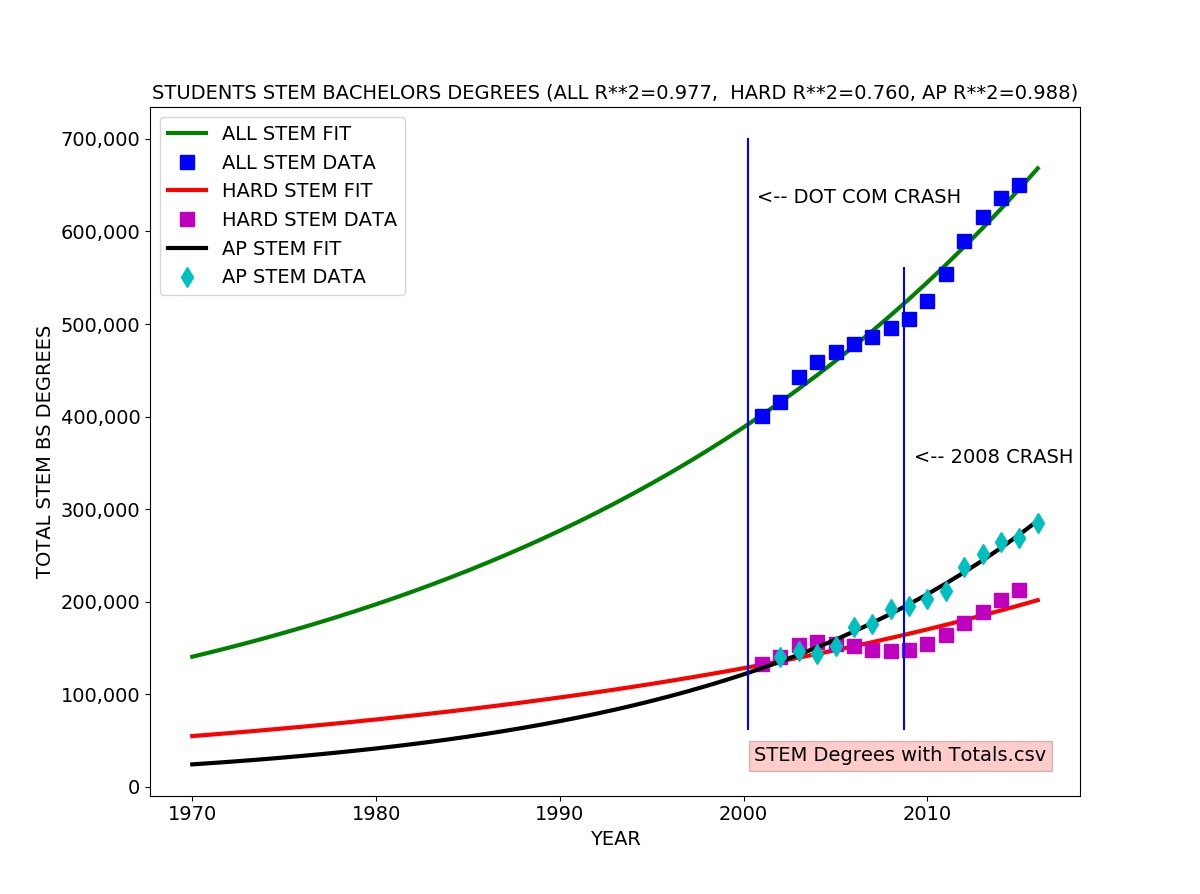
I looked at the total Science and Engineering bachelors degrees granted each year which includes degrees in Social Science, Psychology, Biological and agricultural sciences as well as hard core Engineering, Computer Science, Mathematics, and Physical Sciences. I also looked specifically at the totals for “hard” STEM degrees (Engineering, Computer Science, Mathematics, and Physical Sciences). I also included the total number of K-12 students who pass (score 3,4, or 5 out of 5) on the Advanced Placement (AP) Calculus Exam (either the AB exam or the more advanced BC exam) each year.

I fitted an exponential growth model to each data series. The exponential growth model fits well to the total STEM degrees and AP passing data. The exponential growth model roughly agrees with the hard STEM degree data, but there is a clear difference, reflected in the coefficient of determination (R-SQUARED) of 0.76 meaning the model explains about 76 percent of the variation in the data.

One can easily see the the number of hard STEM degrees significantly exceeds the trend line in the early 00’s (2000 to about 2004) and drops well below from 2004 to 2008, rebounding in 2008. This probably reflects the surge in CS degrees specifically due to the Internet/dot com bubble (1995-2001).

There appears to be a lag of about four years between the actual dot com crash usually dated to a stock market drop in March of 2000 and the drop in production of STEM bachelor’s degrees in about 2004.

Analysis results:

TOTAL Scientists and Engineers 2016: 6,900,000

ALL STEM Bachelor's Degrees
ESTIMATED TOTAL IN 2016 SINCE 1970: 15,970,052
TOTAL FROM 2001 to 2015 (Science and Engineering Indicators 2018)  7,724,850
ESTIMATED FUTURE STUDENTS (2016 to 2026): 8,758,536
ANNUAL GROWTH RATE:  3.45 %  US POPULATION GROWTH RATE (2016): 0.7 %

HARD STEM DEGREES ONLY (Engineering, Physical Sciences, Math, CS)
ESTIMATED TOTAL IN 2016 SINCE 1970: 5,309,239
TOTAL FROM 2001 to 2015 (Science and Engineering Indicators 2018)  2,429,300
ESTIMATED FUTURE STUDENTS (2016 to 2026): 2,565,802
ANNUAL GROWTH RATE:  2.88 %  US POPULATION GROWTH RATE (2016): 0.7 %

STUDENTS PASSING AP CALCULUS EXAM
ESTIMATED TOTAL IN 2016 SINCE 1970: 5,045,848
TOTAL FROM 2002 to 2016  (College Board)  3,038,279
ESTIMATED FUTURE STUDENTS (2016 to 2026): 4,199,602
ANNUAL GROWTH RATE:  5.53 %  US POPULATION GROWTH RATE (2016): 0.7 %
estimate_college_stem.py ALL DONE

The table below gives the raw numbers from Figure 02-10 in the NSF Science and Engineering Indicators 2018 report with a column for total STEM degrees and a column for total STEM degrees in hard science and technology subjects (Engineering, Computer Science, Mathematics, and Physical Sciences) added for clarity:

STEM Degrees Table fig02-10 Revised

In the raw numbers, we see steady growth in social science and psychology STEM degrees from 2000 to 2015 with no obvious sign of the Internet/dot com bubble. There is a slight drop in Biological and agricultural sciences degrees in the early 00s. Somewhat larger drops can be seen in Engineering and Physical Sciences degrees in the early 00’s as well as a concomittant sharp rise in Computer Science (CS) degrees. This probably reflects strong STEM students shifting into CS degrees.

The number of K-12 students taking and passing the AP Calculus Exam (either the AB or more advanced BC exam) grows continuously and rapidly during the entire period from 1997 to 2016, growing at over five percent per year, far above the United States population growth rate of 0.7 percent per year.

The number of college students earning hard STEM degrees appears to be slightly smaller than the four year lagged number of K-12 students passing the AP exam, suggesting some attrition of strong STEM students at the college level. We might expect the number of hard STEM bachelors degrees granted each year to be the same or very close to the number of AP Exam passing students four years earlier.

A model using only the hard STEM bachelors degree students gives a total number of STEM college students produced since 1970 of five million, pretty close to the number of K-12 students estimated from the AP Calculus exam data. This is somewhat less than the 6.9 million total employed STEM workers estimated by the United States Bureau of Labor Statistics.

Including all STEM degrees gives a huge surplus of STEM students/workers, most not employed in a STEM field as reported by the US Census and numerous media reports.

The hard STEM degree model predicts about 2.5 million new STEM workers graduating between 2016 and 2026. This is slightly more than the number of STEM job openings seemingly predicted by the Bureau of Labor Statistics (about 800,000 new STEM jobs and about 1.5 million retirements and deaths of current aging STEM workers giving a total of about 2.3 million “new” jobs). The AP student model predicts about 4 million new STEM workers, far exceeding the BLS predictions and most other STEM employment predictions.

The data and models do not include the effects of immigration and guest worker programs such as the controversial H1-B visa, L1 visa, OPT visa, and O (“Genius”) visa. Immigrants and guest workers play an outsized role in the STEM labor force and specifically in the computer science/software labor force (estimated at 3-4 million workers, over half of the STEM labor force).

Difficulty of Evaluating “Soft” STEM Degrees

Social science, psychology, biological and agricultural sciences STEM degrees vary widely in rigor and technical requirements. The pioneering statistician Ronald Fisher developed many of his famous methods as an agricultural researcher at the Rothamsted agricultural research institute. The leading data analysis tool SAS from the SAS Institute was originally developed by agricultural researchers at North Carolina State University. IBM’s SPSS (Statistics Package for Social Sciences) data analysis tool, number three in the market, was developed for social sciences. Many “hard” sciences such as experimental particle physics use methods developed by Fisher and other agricultural and social scientists. Nonetheless, many “soft” science STEM degrees do not involve the same level of quantitative, logical, and programming skills typical of “hard” STEM fields.

In general, STEM degrees at the college level are not highly standardized. There is no national or international standard test or tests comparable to the AP Calculus exams at the K-12 level to get a good national estimate of the number of qualified students.

The numbers suggest but do not prove that most K-12 students who take and pass AP Calculus continue on to hard STEM degrees or some type of rigorous biology or agricultural sciences degree — hence the slight drop in biology and agricultural science degrees during the dot com bubble period with students shifting to CS degrees.

Conclusion

Both the college “hard” STEM degree data and the K-12 AP Calculus exam data strongly suggest that the United States can and will produce more qualified STEM students than job openings predicted for the 2016 to 2026 period. Somewhat more according to the college data, much more according to the AP exam data, and a huge surplus if all STEM degrees including psychology and social science are considered. The data and models do not include the substantial number of immigrants and guest workers in STEM jobs in the United States.

NOTE: The raw data in text CSV (comma separated values) format and the Python analysis program are included in the appendix below.

(C) 2018 by John F. McGowan, Ph.D.

About Me

John F. McGowan, Ph.D. solves problems using mathematics and mathematical software, including developing gesture recognition for touch devices, video compression and speech recognition technologies. He has extensive experience developing software in C, C++, MATLAB, Python, Visual Basic and many other programming languages. He has been a Visiting Scholar at HP Labs developing computer vision algorithms and software for mobile devices. He has worked as a contractor at NASA Ames Research Center involved in the research and development of image and video processing algorithms and technology. He has published articles on the origin and evolution of life, the exploration of Mars (anticipating the discovery of methane on Mars), and cheap access to space. He has a Ph.D. in physics from the University of Illinois at Urbana-Champaign and a B.S. in physics from the California Institute of Technology (Caltech).
Appendix: Source Code and Raw Data

AP Calculus Totals.csv

Year,Total
2016.0,284750.0
2015.0,268316.0
2014.0,264023.0
2013.0,251354.0
2012.0,237184.0
2011.0,211890.0
2010.0,202336.0
2009.0,195667.0
2008.0,191664.0
2007.0,176072.0
2006.0,172396.0
2005.0,151935.0
2004.0,143779.0
2003.0,146996.0
2002.0,139917.0

STEM Degrees with Totals.csv

Year,Social sciences,Biological and agricultural sciences,Psychology,Engineering,Computer sciences,Physical sciences,Mathematics and statistics,Total STEM,Total Hard STEM
2000,113.50,83.13,74.66,59.49,37.52,18.60,11.71,398.61,127.32
2001,114.47,79.48,74.12,59.21,43.60,18.11,11.44,400.43,132.36
2002,119.11,79.03,77.30,60.61,49.71,17.98,12.25,415.99,140.55
2003,129.74,81.22,79.16,63.79,57.93,18.06,12.86,442.76,152.64
2004,137.74,81.81,82.61,64.68,59.97,18.12,13.74,458.67,156.51
2005,144.57,85.09,86.03,66.15,54.59,18.96,14.82,470.21,154.52
2006,148.11,90.28,88.55,68.23,48.00,20.38,15.31,478.86,151.92
2007,150.73,97.04,90.50,68.27,42.60,21.08,15.55,485.77,147.50
2008,155.67,100.87,92.99,69.91,38.92,21.97,15.84,496.17,146.64
2009,158.18,104.73,94.74,70.60,38.50,22.48,16.21,505.44,147.79
2010,163.07,110.02,97.75,74.40,40.11,23.20,16.83,525.38,154.54
2011,172.18,116.41,101.57,78.10,43.59,24.50,18.02,554.37,164.21
2012,177.33,124.96,109.72,83.26,47.96,26.29,19.81,589.33,177.32
2013,179.26,132.31,115.37,87.81,51.59,27.57,21.57,615.48,188.54
2014,177.94,138.32,118.40,93.95,56.13,28.95,22.23,635.92,201.26
2015,173.72,144.58,118.77,99.91,60.31,29.64,23.14,650.07,213.00

estimate_college_stem.py

#
#  Estimate the total production of STEM students at the
#  College level from BS degrees granted (United States)
#
#  (C) 2018 by John F. McGowan, Ph.D. (ceo@mathematical-software.com)
#

# Python standard libraries
import os
import sys
import time

# Numerical/Scientific Python libraries
import numpy as np
import scipy.optimize as opt  # curve_fit()
import pandas as pd  # reading text CSV files etc.

# Graphics
import matplotlib.pyplot as plt
import matplotlib.ticker as ticker
from mpl_toolkits.mplot3d import Axes3D

# customize fonts
SMALL_SIZE = 8
MEDIUM_SIZE = 10
LARGE_SIZE = 12
XL_SIZE = 14
XXL_SIZE = 16

plt.rc('font', size=XL_SIZE)          # controls default text sizes
plt.rc('axes', titlesize=XL_SIZE)     # fontsize of the axes title
plt.rc('axes', labelsize=XL_SIZE)     # fontsize of the x and y labels
plt.rc('xtick', labelsize=XL_SIZE)    # fontsize of the tick labels
plt.rc('ytick', labelsize=XL_SIZE)    # fontsize of the tick labels
plt.rc('legend', fontsize=XL_SIZE)    # legend fontsize
plt.rc('figure', titlesize=XL_SIZE)   # fontsize of the figure title

# STEM Bachelors Degrees earned by year (about 2000 to 2015)
#
# data from National Science Foundation (NSF)/ National Science Board
# Science and Engineering Indicators 2018 Report
# https://www.nsf.gov/statistics/2018/nsb20181/
# Figure 02-10
#
input_file = "STEM Degrees with Totals.csv"

if len(sys.argv) > 1:
    index = 1
    while index < len(sys.argv):
        if sys.argv[index] in ["-i", "-input"]:
            input_file = sys.argv[index+1]
            index += 1
        elif sys.argv[index] in ["-h", "--help", "-help", "-?"]:
            print("Usage:", sys.argv[0], " -i input_file='AP Calculus Totals by Year.csv'")
            sys.exit(0)
        index +=1

print(__file__, "started", time.ctime())  # time stamp
print("Processing data from: ", input_file)

# read text CSV file (exported from spreadsheet)
df = pd.read_csv(input_file)

# drop NaNs for missing values in Pandas
df.dropna()

# get number of students who pass AP Calculus Exam (AB or BC)
# each year
df_ap_pass = pd.read_csv("AP Calculus Totals.csv")
ap_year = df_ap_pass.values[:,0]
ap_total = df_ap_pass.values[:,1] 

# numerical data
hard_stem_str = df.values[1:,-1] # engineering, physical sciences, math/stat, CS
all_stem_str = df.values[1:,-2]  # includes social science, psychology, agriculture etc.

hard_stem = np.zeros(hard_stem_str.shape)
all_stem = np.zeros(all_stem_str.shape)

for index, val in enumerate(hard_stem_str.ravel()):
    if isinstance(val, str):
        hard_stem[index] = np.float(val.replace(',',''))
    elif isinstance(val, (float, np.float)):
        hard_stem[index] = val
    else:
        raise TypeError("unsupported type " + str(type(val)))

for index, val in enumerate(all_stem_str.ravel()):
    if isinstance(val, str):
        all_stem[index] = np.float(val.replace(',', ''))
    elif isinstance(val, (float, np.float)):
        all_stem[index] = val
    else:
        raise TypeError("unsupported type " + str(type(val)))

DEGREES_PER_UNIT = 1000
# units are thousands of degrees granted 
all_stem = DEGREES_PER_UNIT*all_stem
hard_stem = DEGREES_PER_UNIT*hard_stem
    
years_str = df.values[1:,0]
years = np.zeros(years_str.shape)
for index, val in enumerate(years_str.ravel()):
    years[index] = np.float(val)

# almost everyone in the labor force graduated since 1970
# someone 18 years old in 1970 is 66 today (2018)
START_YEAR = 1970

def my_exp(x, *p):
    """
    exponential model for curve_fit(...)
    """
    return p[0]*np.exp(p[1]*(x - START_YEAR))

# starting guess for model parameters
p_start = [ 50000.0, 0.01 ]

# fit all STEM degree data
popt, pcov = opt.curve_fit(my_exp, years, all_stem, p_start)

# fit hard STEM degree data
popt_hard_stem, pcov_hard_stem = opt.curve_fit(my_exp, \
                                               years, \
                                               hard_stem, \
                                               p_start)
# fit AP Students data
popt_ap, pcov_ap = opt.curve_fit(my_exp, \
                                 ap_year, \
                                 ap_total, \
                                 p_start)

print(popt)  # sanity check

STOP_YEAR = 2016
NYEARS = (STOP_YEAR - START_YEAR + 1)

years_fit = np.linspace(START_YEAR, STOP_YEAR, NYEARS)
n_fit = my_exp(years_fit, *popt)

n_pred = my_exp(years, *popt)

r2 = 1.0 - (n_pred - all_stem).var()/all_stem.var()
r2_str = "%4.3f" % r2

n_fit_hard = my_exp(years_fit, *popt_hard_stem)
n_pred_hard = my_exp(years, *popt_hard_stem)

r2_hard = 1.0 - (n_pred_hard - hard_stem).var()/hard_stem.var()
r2_hard_str = "%4.3f" % r2_hard

n_fit_ap = my_exp(years_fit, *popt_ap)
n_pred_ap = my_exp(ap_year, *popt_ap)

r2_ap = 1.0 - (n_pred_ap - ap_total).var()/ap_total.var()
r2_ap_str = "%4.3f" % r2_ap


cum_all_stem = n_fit.sum()
cum_hard_stem = n_fit_hard.sum()
cum_ap_stem = n_fit_ap.sum()

# to match BLS projections
future_years = np.linspace(2016, 2026, 11)

assert future_years.size == 11  # sanity check

future_students = my_exp(future_years, *popt)
future_students_hard = my_exp(future_years, *popt_hard_stem)
future_students_ap = my_exp(future_years, *popt_ap)

# https://fas.org/sgp/crs/misc/R43061.pdf
#
# The U.S. Science and Engineering Workforce: Recent, Current,
# and Projected Employment, Wages, and Unemployment
#
# by John F. Sargent Jr.
# Specialist in Science and Technology Policy
# November 2, 2017
#
# Congressional Research Service 7-5700 www.crs.gov R43061
#
# "In 2016, there were 6.9 million scientists and engineers (as
# defined in this report) employed in the United States, accounting
# for 4.9 % of total U.S. employment."
#

# BLS astonishing/bizarre projections for 2016-2026

# "The Bureau of Labor Statistics (BLS) projects that the number of S&E
# jobs will grow by 853,600 between 2016 and 2026 , a growth rate
# (1.1 % CAGR) that is somewhat faster than that of the overall
# workforce ( 0.7 %). In addition, BLS projects that 5.179 million
# scientists and engineers will be needed due to labor force exits and
# occupational transfers (referred to collectively as occupational
# separations ). BLS projects the total number of openings in S&E due to growth ,
# labor force exits, and occupational transfers between 2016 and 2026 to be
# 6.033 million, including 3.477 million in the computer occupations and
# 1.265 million in the engineering occupations."

# NOTE: This appears to project 5.170/6.9 or 75 percent!!!! of current STEM
# labor force LEAVE THE STEM PROFESSIONS by 2026!!!!

# "{:,}".format(value) to specify the comma separated thousands format
#
print("TOTAL Scientists and Engineers 2016:", "{:,.0f}".format(6.9e6))
# ALL STEM
print("\nALL STEM Bachelor's Degrees")
print("ESTIMATED TOTAL IN 2016 SINCE ", START_YEAR, ": ", \
      "{:,.0f}".format(cum_all_stem), sep='')
# don't use comma grouping for years
print("TOTAL FROM", "{:.0f}".format(years_str[0]), \
      "to 2015 (Science and Engineering Indicators 2018) ", \
      "{:,.0f}".format(all_stem.sum()))
print("ESTIMATED FUTURE STUDENTS (2016 to 2026):", \
      "{:,.0f}".format(future_students.sum()))
# annual growth rate of students taking AP Calculus
growth_rate_pct = (np.exp(popt[1]) - 1.0)*100

print("ANNUAL GROWTH RATE: ", "{:,.2f}".format(growth_rate_pct), \
      "%  US POPULATION GROWTH RATE (2016): 0.7 %")

# HARD STEM

print("\nHARD STEM DEGREES ONLY (Engineering, Physical Sciences, Math, CS)")
print("ESTIMATED TOTAL IN 2016 SINCE ", START_YEAR, ": ", \
      "{:,.0f}".format(cum_hard_stem), sep='')
# don't use comma grouping for years
print("TOTAL FROM", "{:.0f}".format(years_str[0]), \
      "to 2015 (Science and Engineering Indicators 2018) ", \
      "{:,.0f}".format(hard_stem.sum()))
print("ESTIMATED FUTURE STUDENTS (2016 to 2026):", \
      "{:,.0f}".format(future_students_hard.sum()))
# annual growth rate of students taking AP Calculus
growth_rate_pct_hard = (np.exp(popt_hard_stem[1]) - 1.0)*100

print("ANNUAL GROWTH RATE: ", "{:,.2f}".format(growth_rate_pct_hard), \
      "%  US POPULATION GROWTH RATE (2016): 0.7 %")


# AP STEM -- Students passing AP Calculus Exam Each Year 

print("\nSTUDENTS PASSING AP CALCULUS EXAM")
print("ESTIMATED TOTAL IN 2016 SINCE ", START_YEAR, ": ", \
      "{:,.0f}".format(cum_ap_stem), sep='')
# don't use comma grouping for years
print("TOTAL FROM", "{:.0f}".format(ap_year[-1]), \
      "to", "{:.0f}".format(ap_year[0])," (College Board) ", \
      "{:,.0f}".format(ap_total.sum()))
print("ESTIMATED FUTURE STUDENTS (2016 to 2026):", \
      "{:,.0f}".format(future_students_ap.sum()))
# annual growth rate of students taking AP Calculus
growth_rate_pct_ap = (np.exp(popt_ap[1]) - 1.0)*100

print("ANNUAL GROWTH RATE: ", "{:,.2f}".format(growth_rate_pct_ap), \
      "%  US POPULATION GROWTH RATE (2016): 0.7 %")


# US Census reports 0.7 percent annual growth of US population in 2016
# SOURCE: https://www.census.gov/newsroom/press-releases/2016/cb16-214.html
#

f1 = plt.figure(figsize=(12,9))
ax = plt.gca()
# add commas to tick values (e.g. 1,000 instead of 1000)
ax.get_yaxis().set_major_formatter(
    ticker.FuncFormatter(lambda x, p: format(int(x), ',')))

DOT_COM_CRASH = 2000.25  # usually dated march 10, 2000
OCT_2008_CRASH = 2008.75 # usually dated October 11, 2008
DELTA_LABEL_YEARS = 0.5

plt.plot(years_fit, n_fit, 'g', linewidth=3, label='ALL STEM FIT')
plt.plot(years, all_stem, 'bs', markersize=10, label='ALL STEM DATA')
plt.plot(years_fit, n_fit_hard, 'r', linewidth=3, label='HARD STEM FIT')
plt.plot(years, hard_stem, 'ms', markersize=10, label='HARD STEM DATA')
plt.plot(years_fit, n_fit_ap, 'k', linewidth=3, label='AP STEM FIT')
plt.plot(ap_year, ap_total, 'cd', markersize=10, label='AP STEM DATA')
[ylow, yhigh] = plt.ylim()
dy = yhigh - ylow
# add marker lines for crashes
plt.plot((DOT_COM_CRASH, DOT_COM_CRASH), (ylow+0.1*dy, yhigh), 'b-')
plt.text(DOT_COM_CRASH + DELTA_LABEL_YEARS, 0.9*yhigh, '<-- DOT COM CRASH')
# plt.arrow(...) add arrow (arrow does not render correctly)

plt.plot((OCT_2008_CRASH, OCT_2008_CRASH), (ylow+0.1*dy, 0.8*yhigh), 'b-')
plt.text(OCT_2008_CRASH+DELTA_LABEL_YEARS, 0.5*yhigh, '<-- 2008 CRASH')
plt.legend()
plt.title('STUDENTS STEM BACHELORS DEGREES (ALL R**2=' \
          + r2_str + ',  HARD R**2=' + r2_hard_str + \
          ', AP R**2=' + r2_ap_str + ')')
plt.xlabel('YEAR')
plt.ylabel('TOTAL STEM BS DEGREES')
# appear to need to do this after the plots
# to get valid ranges
[xlow, xhigh] = plt.xlim()
[ylow, yhigh] = plt.ylim()
dx = xhigh - xlow
dy = yhigh - ylow
# put input data file name in lower right corner
plt.text(xlow + 0.65*dx, \
         ylow + 0.05*dy, \
         input_file, \
         bbox=dict(facecolor='red', alpha=0.2))

plt.show()

f1.savefig('College_STEM_Degrees.jpg')

print(__file__, "ALL DONE")

Video Commentary on Better K-12 STEM Student Numbers

AP Calculus Model Revised 1997 to 2016 Data


(C) 2018 by John F. McGowan, Ph.D.

About Me

John F. McGowan, Ph.D. solves problems using mathematics and mathematical software, including developing gesture recognition for touch devices, video compression and speech recognition technologies. He has extensive experience developing software in C, C++, MATLAB, Python, Visual Basic and many other programming languages. He has been a Visiting Scholar at HP Labs developing computer vision algorithms and software for mobile devices. He has worked as a contractor at NASA Ames Research Center involved in the research and development of image and video processing algorithms and technology. He has published articles on the origin and evolution of life, the exploration of Mars (anticipating the discovery of methane on Mars), and cheap access to space. He has a Ph.D. in physics from the University of Illinois at Urbana-Champaign and a B.S. in physics from the California Institute of Technology (Caltech).