[Article] The US CDC’s Broad Legal Disclaimer for the Fluview Interactive COVID Death Numbers

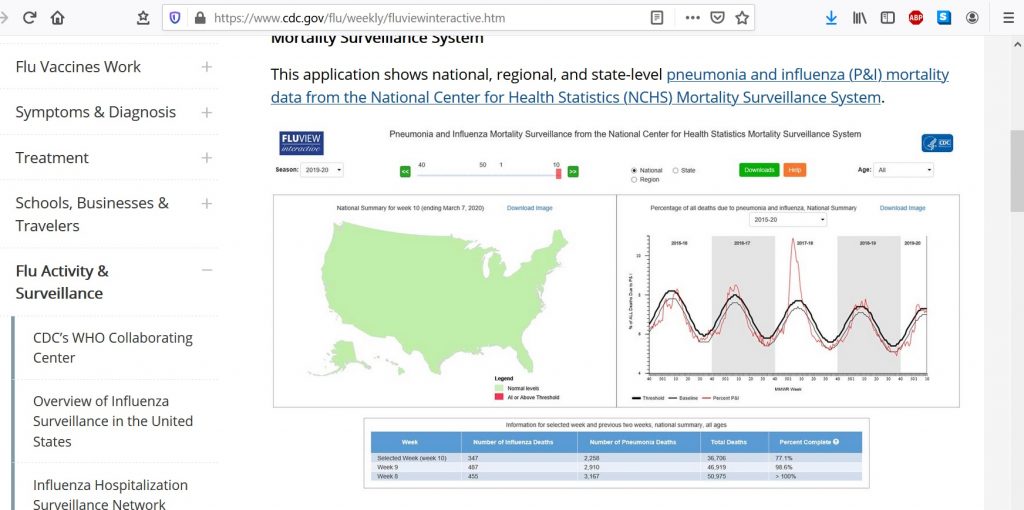
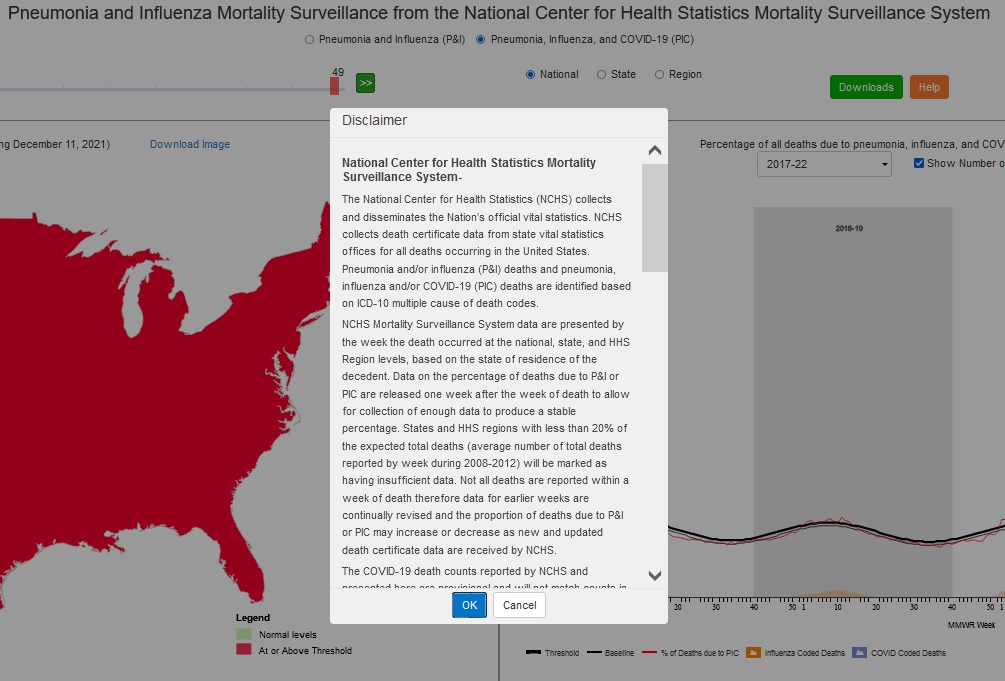
This is the legal disclaimer that appears when starting the US Centers for Disease Control (CDC’s) Fluview Interactive application which purports to report the percentage of deaths per week “due to” pneumonia and influenza (P&I) prior to March 2020 and pneumonia, influenza, and COVID-19 (PIC) since March 2020. (URL: http://gis.cdc.gov/grasp/fluview/mortality.html )

Emphasis is added to key phrases. The NOTES explain the definition and meaning of several technical terms used in the disclaimer.

The disclaimer essentially says, in plain English, the data — the COVID-19 death counts — which is presented with no estimates of statistical or systematic errors is provisional and could be entirely wrong. Two sentences in one paragraph appear to contradict one another.

The CDC had a budget of just over $12 billion in the Fiscal Year 2019. URL: https://www.cdc.gov/budget/documents/fy2019/fy-2019-detail-table.pdf

Disclaimer (Downloaded December 24, 2021)

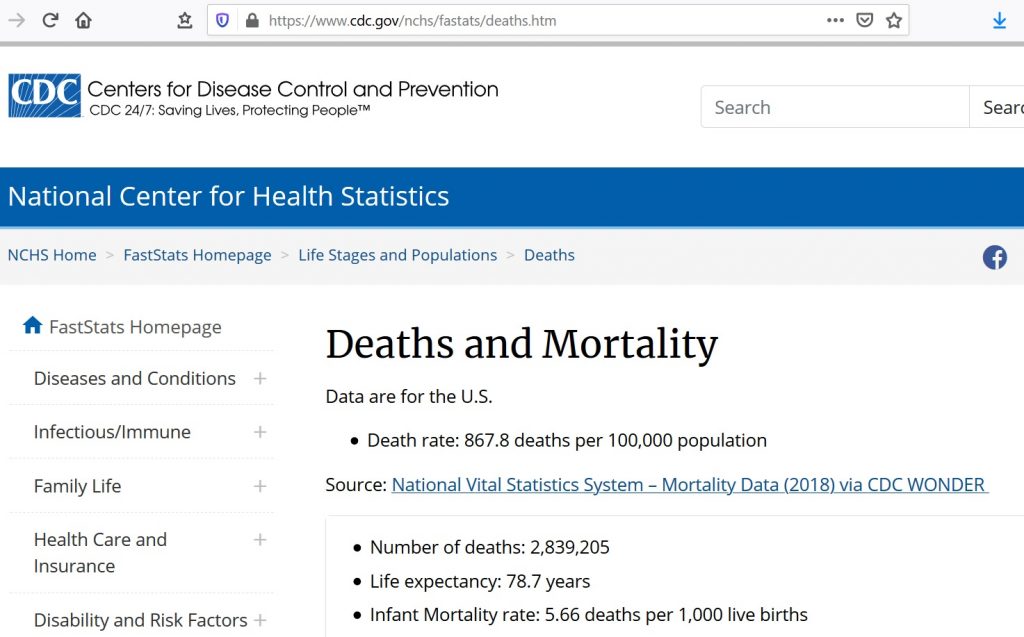
National Center for Health Statistics Mortality Surveillance System-

NOTE: The National Center for Health Statistics (NCHS) is a division of the US Centers for Disease Control and Prevention (CDC).

The National Center for Health Statistics (NCHS) collects and disseminates the Nation’s official vital statistics. NCHS collects death certificate data from state vital statistics offices for all deaths occurring in the United States. Pneumonia and/or influenza (P&I) deaths and pneumonia, influenza and/or COVID-19 (PIC) deaths are identified based on ICD-10 multiple cause of death codes.

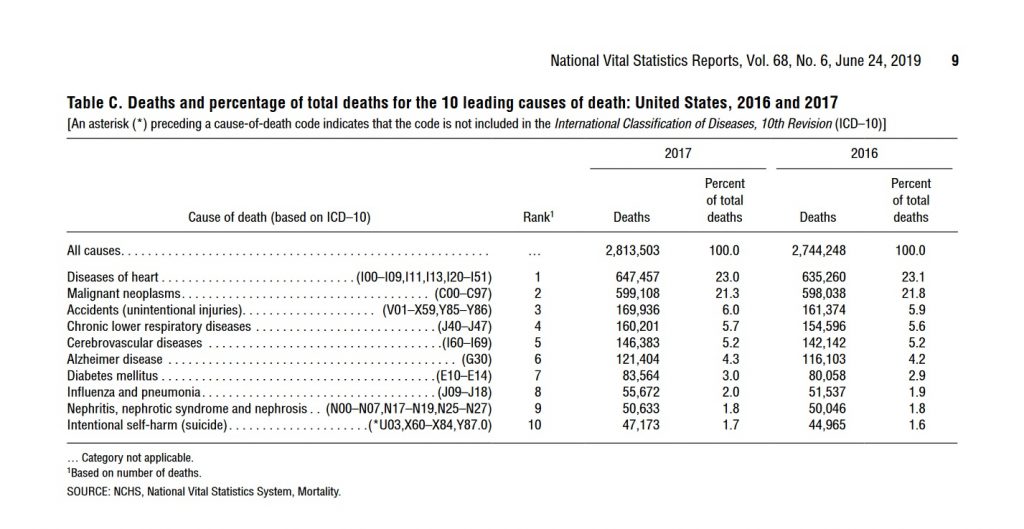
NOTE: ICD-10 is the International Classification of Diseases 10th Edition, a medical classification list by the World Health Organization (WHO). “ICD-10 multiple cause of death codes” refers to multiple “causes of death” listed on death certificates. Many death certificates have many causes of death such as emphysema, a degenerative eventually terminal condition, and pneumonia. One cause of the death is singled out as the “underlying cause of death” or UCOD. One cause of death is singled out as the “immediate cause of death.” The immediate cause of death is often not the underlying cause of death. For example, emphysema may be the underlying cause of death and pneumonia, the influenza virus, or the “common cold” may be the immediate cause of death.

NCHS Mortality Surveillance System data are presented by the week the death occurred at the national, state, and HHS Region levels, based on the state of residence of the decedent. Data on the percentage of deaths due to P&I or PIC are released one week after the week of death to allow for collection of enough data to produce a stable percentage. States and HHS regions with less than 20% of the expected total deaths (average number of total deaths reported by week during 2008-2012) will be marked as having insufficient data. Not all deaths are reported within a week of death therefore data for earlier weeks are continually revised and the proportion of deaths due to P&I or PIC may increase or decrease as new and updated death certificate data are received by NCHS.

NOTE: Notice the conflict between “to allow for collection of enough data to produce a stable percentage” and “the proportion of deaths due to P&I or PIC may increase or decrease as new and updated death certificate data are received by NCHS.”  Percentage is a way of expressing the proportion: for example, fifty percent (a percentage) versus one half (another way of expressing the same percentage).  “Stable” usually means not changing or fluctuating” (Merriam Webster) when used in this way.

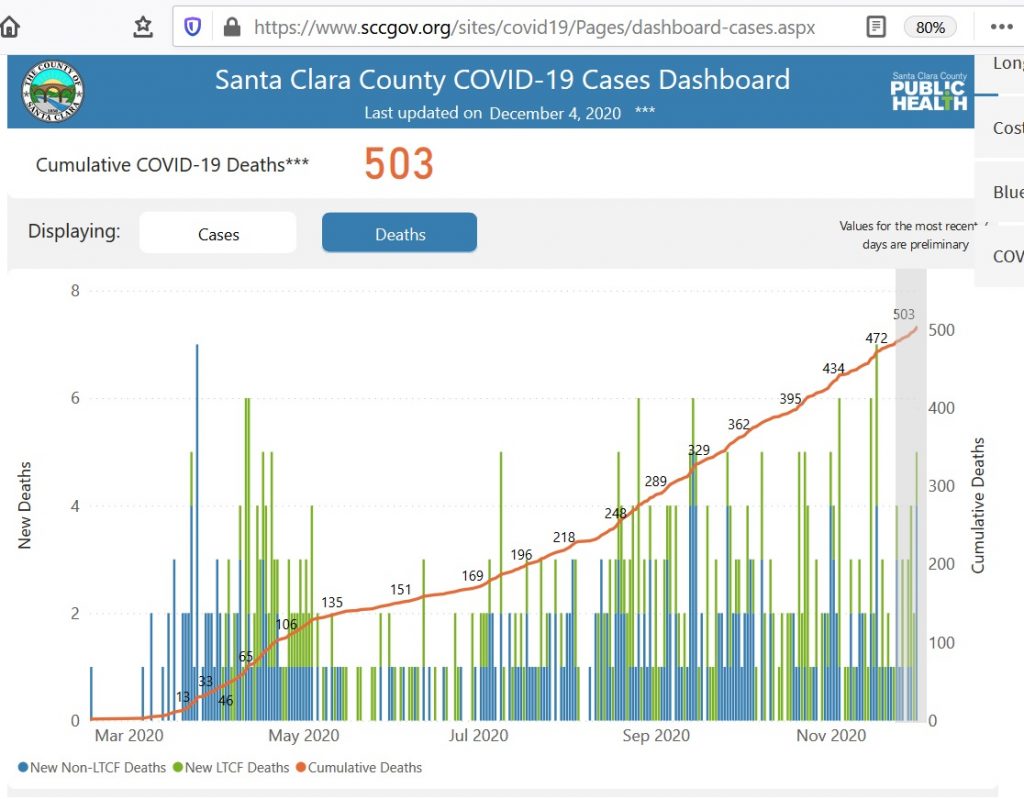
The COVID-19 death counts reported by NCHS and presented here are provisional and will not match counts in other sources, such as media reports or numbers from county health departments. COVID-19 deaths may be classified or defined differently in various reporting and surveillance systems. Death counts reported by NCHS include deaths that have COVID-19 listed as a cause of death and may include laboratory confirmed COVID-19 deaths and clinically confirmed COVID-19 deaths. Provisional death counts reported by NCHS track approximately 1-2 weeks behind other published data sources on the number of COVID-19 deaths in the U.S. These reasons may partly account for differences between NCHS reported death counts and death counts reported in other sources.

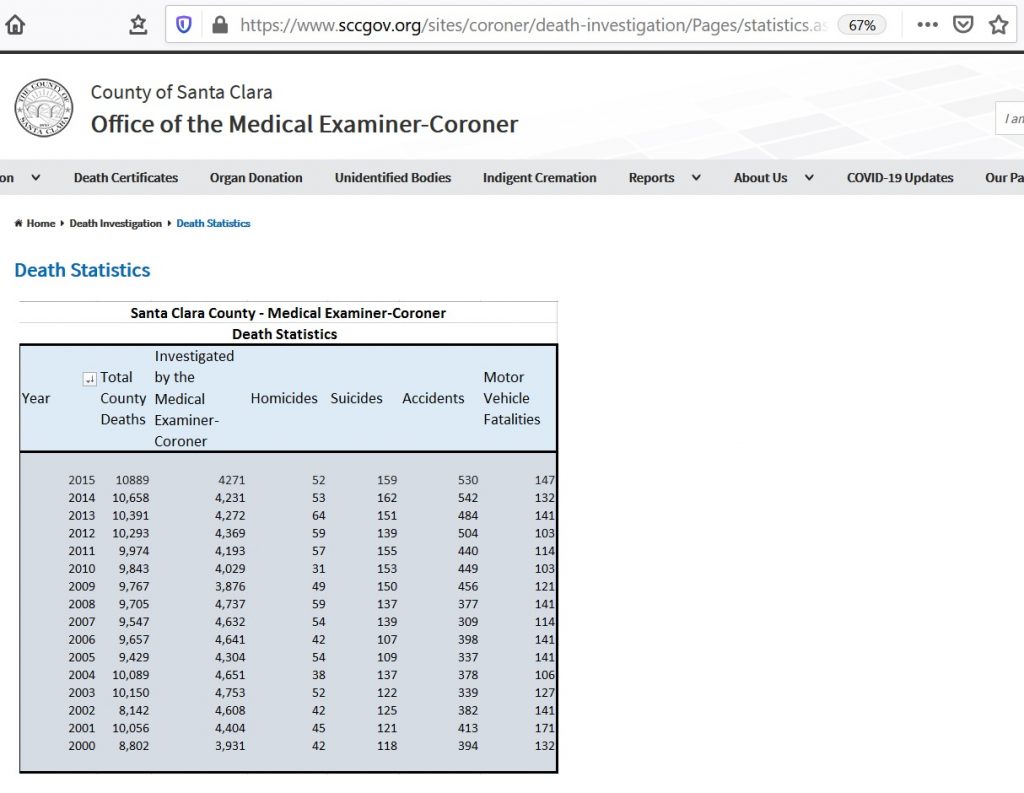
NOTE:  The language “a cause of death” likely means that COVID-19 (or pneumonia or influenza in pre-2020 figures) is one of the causes of death listed on the death certificate, not necessarily the underlying cause of death (UCOD).  Remember, many death certificates have multiple causes of death, one of which is identified as the underlying cause of death. (UCOD).  Note also that the disclaimer specifically states that NCHS numbers “will not match..numbers from county health departments.” County health departments are presumably official, primary sources of death data with qualified staff — medical examiners and others.

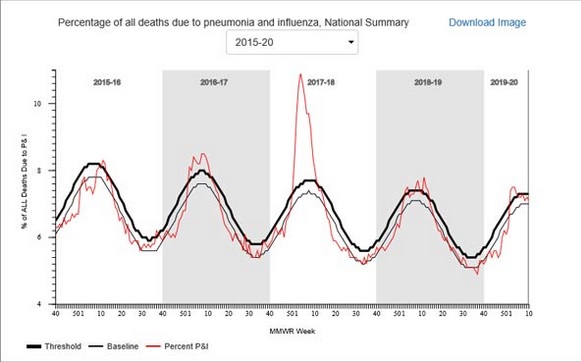
In previous seasons, the NCHS surveillance data were used to calculate the percent of all deaths occurring each week that had pneumonia and/or influenza (P&I) listed as a cause of death. Because of the ongoing COVID-19 pandemic, COVID-19 coded deaths were added to P&I to create the PIC (pneumonia, influenza, and/or COVID-19) classification. PIC includes all deaths with pneumonia, influenza, and/or COVID-19 listed on the death certificate. Because many influenza deaths and many COVID-19 deaths have pneumonia included on the death certificate, P&I no longer measures the impact of influenza in the same way that it has in the past. This is because the proportion of pneumonia deaths associated with influenza is now influenced by COVID-19-related pneumonia. The PIC percentage and the number of influenza and number of COVID-19 deaths will be presented in order to help better understand the impact of these viruses on mortality and the relative contribution of each virus to PIC mortality.

The PIC percentages are compared to a seasonal baseline of P&I deaths that is calculated using a periodic regression model that incorporates a robust regression procedure applied to data from the previous five years. An increase of 1.645 standard deviations above the seasonal baseline of P&I deaths is considered the “epidemic threshold,” i.e., the point at which the observed proportion of deaths is significantly higher than would be expected at that time of the year in the absence of substantial influenza, and now COVID-related mortality. Baselines and thresholds are calculated at the national and regional level and by age groups.

For more information on pneumonia and influenza mortality surveillance please visit: http://www.cdc.gov/flu/weekly/overview.htm#Mortality

* The 10 U.S. Department of Health and Human Services regions include the following jurisdictions. Region 1: Connecticut, Main, Massachusetts, New Hampshire, Rhode Island, and Vermont; Region 2: New Jersey, New York, and New York City; Region 3: Delaware, District of Columbia, Maryland, Pennsylvania, Virginia, and West Virginia; Region 4: Alabama, Florida, Georgia, Kentucky, Mississippi, North Carolina, South Carolina, and Tennessee; Region 5: Illinois, Indiana, Michigan, Minnesota, Ohio, and Wisconsin; Region 6: Arkansas, Louisiana, New Mexico, Oklahoma, and Texas; Region 7: Iowa, Kansas, Missouri, and Nebraska; Region 8: Colorado, Montana, North Dakota, South Dakota, Utah, and Wyoming; Region 9: Arizona, California, Hawaii, and Nevada; Region 10: Alaska, Idaho, Oregon, and Washington.

(C) 2021 by John F. McGowan, Ph.D.

About Me

John F. McGowan, Ph.D. solves problems using mathematics and mathematical software, including developing gesture recognition for touch devices, video compression and speech recognition technologies. He has extensive experience developing software in C, C++, MATLAB, Python, Visual Basic and many other programming languages. He has been a Visiting Scholar at HP Labs developing computer vision algorithms and software for mobile devices. He has worked as a contractor at NASA Ames Research Center involved in the research and development of image and video processing algorithms and technology. He has published articles on the origin and evolution of life, the exploration of Mars (anticipating the discovery of methane on Mars), and cheap access to space. He has a Ph.D. in physics from the University of Illinois at Urbana-Champaign and a B.S. in physics from the California Institute of Technology (Caltech).

[Article] Known Problems with US CDC’s Pneumonia, Influenza, and COVID-19 (PIC) Death Numbers

Introduction

This is a summary (below) of our lengthy (about 13,000 word) paper on the many issues with the CDC’s pneumonia, influenza, and COVID-19 (PIC) death numbers. It is about 1,000 words in length (5-10 minute read) and summarizes most of our key findings.

John F. McGowan, Ph.D., Tam Hunt, Josh Mitteldorf, PhD. Improving CDC Data Practices Recommendations for Improving the United States Centers for Disease Control (CDC) Data Practices for Pneumonia, Influenza, and COVID-19 (v 1.1). Authorea. November 29, 2021. DOI:10.22541/au.163822197.79126460/v1
(https://doi.org/10.22541/au.163822197.79126460/v1)

URL:
https://www.authorea.com/users/425106/articles/547336-improving-cdc-data-practices-recommendations-for-improving-the-united-states-centers-for-disease-control-cdc-data-practices-for-pneumonia-influenza-and-covid-19-v-1-1

Key Points/Summary

A number of CDC data presentation and statistical practices since the start of the COVID-19 pandemic in early 2020 have not followed common scientific and engineering practice. Several problems with data presentation and analyses for pneumonia and influenza death numbers – which have been merged with COVID-19 death numbers in the FluView web site ‒ predate the pandemic.

Before the pandemic (March 2020), the non-standard data presentation and statistical practices appear to increase the number of deaths attributed to the influenza virus and imply the death counts are certain whereas substantial uncertainty exists due to uncertainty in the assignment of the cause of death and other reasons. Since the pandemic, these practices appear to do the same for SARS-COV-2 and COVID-19.

Remarkably, the CDC had at least three (3) different numbers for deaths attributed to pneumonia and influenza before 2020: the leading causes of death report count with about two (2) percent of deaths (about 55,000) per year attributed to influenza and pneumonia, the influenza virus deaths model with about 55,000 deaths per year attributed specifically to the influenza virus, and the FluView web site count with about 6-8 percent of deaths (about 188,000) per year attributed to pneumonia and influenza.

The FluView number differs from the other two death numbers by a factor of OVER THREE. The probable reason for this difference is that — according to the FluView technical notes — FluView counts deaths where pneumonia or influenza is listed as “a cause of death” whereas the leading cause of death report — according to the technical notes — counts only deaths where pneumonia or influenza is listed as “the underlying cause of death.” This probably reflects a large uncertainty in the assignment of the cause of death in respiratory illness cases; indeed the underlying cause of death may be ill-defined in many cases.

The CDC’s excess deaths estimates on their excess deaths web site does not report any standard goodness of fit statistics, notably the coefficient of determination often known as “R squared” and the “chi squared” goodness of fit statistic. Our analysis shows that different models with the same goodness of fit statistics give different estimates of the number of excess deaths, varying by up to 200,000 deaths in 2020. The CDC web site does not report this systematic modeling error.

The CDC appears to have chosen a set of parameters for the Noufaily/Farrington algorithm used to estimate excess deaths by the CDC that gives a lower “R Squared” value for goodness of fit than other choices and a HIGHER ESTIMATE of excess deaths — whereas common scientific and engineering practice would be to use the models with the best goodness of fit statistics, the “R Squared” closest to 1.0.

The Noufailly/Farrington algorithm is an empirical trend detection and extrapolation model theoretically incapable of accurately modeling the aging “baby boom” population which would be expected to produce “excess deaths” in recent years — nor is it able to explain the puzzling near stop of the increase in deaths per year reported in the immediate pre-pandemic years 2017-2019 despite the aging population.

The CDC does not publish (as of Dec 2021) years of life lost (YLL) estimates which include increases in suicides, homicides, and other adverse effects of the lockdowns, nor systematic modeling errors on the YLL estimates. YLL can illustrate the difference between a disease that largely kills those nearing death anyway versus a disease that easily kills the healthy.

The CDC issued a COVID death certificate guidance document in April of 2020 that appears to change the standards for assigning the underlying cause of death (UCOD) from the pre-pandemic practice for assigning the underlying cause of death for pneumonia and influenza, making COVID-19 the underlying cause of death in the many cases where the person who died had serious pre-existing conditions such as chronic bronchitis, emphysema, heart failure etc.. — the deaths counted in FluView but not in the leading causes of death report. There does not appear to have been any public comment on this guidance document to date.

In general the CDC does not report statistical errors, systematic errors, or estimates of biases in pneumonia, influenza, and COVID-19 death numbers. They do not report any monitoring of the effect of their guidance documents or other directives on the assignment of the cause of death by doctors, medical examiners, and others.

These issues are sometimes shared with other government agencies such as the US Social Security Administration (SSA) and US Census Bureau that work closely with the CDC.

Death counts for both individual causes and “all cause” deaths are frequently reported as precise to the last digit without any statistical or systematic errors, despite both known and unknown uncertainties in counting deaths, such as missing persons, unreported deaths due to deceased payee fraud, the ~1,000 living Americans incorrectly added to the government Deaths Master File (DMF), each month, for unknown reasons, and considerable uncertainties in assigning the underlying cause of death (UCOD) by coroners and doctors.

Similarly, raw counts, adjusted counts, and estimates – often based on incompletely documented computer mathematical models – are often not clearly identified as such. The Deaths Master File, with names and dates of death of deceased persons is exempt from the Freedom of Information Act (FOIA) and unavailable to the general public, independent researchers, and even other government agencies such as the IRS. This confidentiality of data makes independent verification of many CDC numbers, such as the excess deaths numbers tracked during the COVID-19 pandemic, all but impossible.

This omission of common scientific and engineering practices raises questions about the accuracy of the CDC’s data, conclusions, and public health policies in a number of important areas, including the COVID-19 pandemic.

The non-standard data presentation and statistical practices appear to increase the number of deaths attributed to the influenza virus and imply the death counts are certain whereas substantial uncertainty exists due to uncertainty in the assignment of the cause of death and other causes. Since the pandemic, these practices appear to do the same for SARS-COV-2 and COVID-19.

END OF SUMMARY

(C) 2021 by John F. McGowan, Ph.D.

About Me

John F. McGowan, Ph.D. solves problems using mathematics and mathematical software, including developing gesture recognition for touch devices, video compression and speech recognition technologies. He has extensive experience developing software in C, C++, MATLAB, Python, Visual Basic and many other programming languages. He has been a Visiting Scholar at HP Labs developing computer vision algorithms and software for mobile devices. He has worked as a contractor at NASA Ames Research Center involved in the research and development of image and video processing algorithms and technology. He has published articles on the origin and evolution of life, the exploration of Mars (anticipating the discovery of methane on Mars), and cheap access to space. He has a Ph.D. in physics from the University of Illinois at Urbana-Champaign and a B.S. in physics from the California Institute of Technology (Caltech).

[Video] Many Routes for Rapid Spread of COVID-19 in Santa Clara County, California

Many Seeming Routes for Efficient Spread of COVID-19 in Santa Clara County, California (USA)

Twenty minute video on many seeming routes for efficient spread of COVID-19 in Santa Clara County, California, USA (Silicon Valley). Discusses herding of residents into Big Box retail stores such as Safeway, Target, and Walmart, large apartment complexes, the VTA bus system, and construction projects with many shared spaces and surfaces.

Alternative Video Links: NewTube Archive LBRY Brighteon

References/Links:

Article: http://wordpress.jmcgowan.com/wp/many-seeming-routes-for-efficient-spread-of-covid-19-in-santa-clara-county-california/

About Us:

Main Web Site: https://mathematical-software.com/
Censored Search: https://censored-search.com/
A search engine for censored Internet content. Find the answers to your problems censored by advertisers and other powerful interests!

Subscribe to our free Weekly Newsletter for articles and videos on practical mathematics, Internet Censorship, ways to fight back against censorship, and other topics by sending an email to: subscribe [at] mathematical-software.com

Avoid Internet Censorship by Subscribing to Our RSS News Feed: http://wordpress.jmcgowan.com/wp/feed/

Legal Disclaimers: http://wordpress.jmcgowan.com/wp/legal/

Support Us:
PATREON: https://www.patreon.com/mathsoft
SubscribeStar: https://www.subscribestar.com/mathsoft

BitChute (Video): https://www.bitchute.com/channel/HGgoa2H3WDac/
Brighteon (Video): https://www.brighteon.com/channels/mathsoft
LBRY (Video): https://lbry.tv/@MathematicalSoftware:5

(C) 2021 by John F. McGowan, Ph.D.

About Me

John F. McGowan, Ph.D. solves problems using mathematics and mathematical software, including developing gesture recognition for touch devices, video compression and speech recognition technologies. He has extensive experience developing software in C, C++, MATLAB, Python, Visual Basic and many other programming languages. He has been a Visiting Scholar at HP Labs developing computer vision algorithms and software for mobile devices. He has worked as a contractor at NASA Ames Research Center involved in the research and development of image and video processing algorithms and technology. He has published articles on the origin and evolution of life, the exploration of Mars (anticipating the discovery of methane on Mars), and cheap access to space. He has a Ph.D. in physics from the University of Illinois at Urbana-Champaign and a B.S. in physics from the California Institute of Technology (Caltech).

[Video] Improbably Low COVID-19 Deaths in Santa Clara County, California (USA)

Improbably Low COVID-19 Deaths in Santa Clara County, California (December 4, 2020)

Alternative Video Links: Brighteon Archive.org LBRY Minds

Despite frightening headlines and increased lockdown orders, total COVID-19 deaths in Santa Clara County, California remain remarkably low with total officially reported deaths of only 503 in a county with 1.9 million and close contact with China, the presumed source of the pandemic. This is a number comparable to the number of expected deaths in the county from ordinary pneumonia and influenza based on previous years.

The county continues to authorize many luxury apartment and other construction projects with teams of workers in close proximity five full days per week, after a brief 3-4 week shutdown in May. The lockdown continues to herd large numbers of citizens into a few gigantic stores such as Safeway, Walmart, and Target, enabling what would seem like an efficient route for rapid spread of the disease.

References/Links:

Full Text Article: http://wordpress.jmcgowan.com/wp/improbably-low-covid-19-death-numbers-in-santa-clara-county-california-december-2020/

Santa Clara County COVID Dashboard: https://www.sccgov.org/sites/covid19/Pages/dashboard-cases.aspx

US Census Population of Santa Clara County: https://www.census.gov/quickfacts/fact/table/santaclaracountycalifornia/PST045219

Santa Clara County Death Statistics: https://www.sccgov.org/sites/coroner/death-investigation/Pages/statistics.aspx

US CDC United States Death Rate for 2018: https://www.cdc.gov/nchs/fastats/deaths.htm

US CDC FluView Web Site (click P&I Mortality Tab): https://www.cdc.gov/flu/weekly/fluviewinteractive.htm

New York Times on 430,000 Traveled from China to US Since Coronavirus Surface: https://www.nytimes.com/2020/04/04/us/coronavirus-china-travel-restrictions.html

First US COVID Death in Santa Clara County: https://www.sfchronicle.com/bayarea/article/First-U-S-COVID-19-death-was-57-year-old-Santa-15218813.php

Construction Projects Authorized in Santa Clara County: https://www.sccgov.org/sites/covid19/Pages/mandatory-directives-construction.aspx

Leading Causes of Death Report (see Table C, Page Nine): https://www.cdc.gov/nchs/data/nvsr/nvsr68/nvsr68_06-508.pdf

About Us:

Main Web Site: https://mathematical-software.com/
Censored Search: https://censored-search.com/
A search engine for censored Internet content. Find the answers to your problems censored by advertisers and other powerful interests!

Subscribe to our free Weekly Newsletter for articles and videos on practical mathematics, Internet Censorship, ways to fight back against censorship, and other topics by sending an email to: subscribe [at] mathematical-software.com

Avoid Internet Censorship by Subscribing to Our RSS News Feed: http://wordpress.jmcgowan.com/wp/feed/

Legal Disclaimers: http://wordpress.jmcgowan.com/wp/legal/

Support Us:
PATREON: https://www.patreon.com/mathsoft
SubscribeStar: https://www.subscribestar.com/mathsoft

BitChute (Video): https://www.bitchute.com/channel/HGgoa2H3WDac/
Brighteon (Video): https://www.brighteon.com/channels/mathsoft
LBRY (Video): https://lbry.tv/@MathematicalSoftware:5

#

Improbably Low COVID-19 Death Numbers in Santa Clara County California (December 2020)

Despite frightening headlines and increased lockdown orders, total COVID-19 deaths in Santa Clara County, California remain remarkably low with total officially reported deaths of only 503 in a county with 1.9 million and close contact with China, the presumed source of the pandemic. This is a number comparable to the number of expected deaths in the county from ordinary pneumonia and influenza based on previous years.

The county continues to authorize many luxury apartment and other construction projects with teams of workers in close proximity five full days per week, after a brief 3-4 week shutdown in May. The lockdown continues to herd large numbers of citizens into a few gigantic stores such as Safeway, Walmart, and Target, enabling what would seem like an efficient route for rapid spread of the disease.

This is the Santa Clara County COVID-19 Cases Dashboard (Deaths) on Friday, December 4, 2020.

https://www.sccgov.org/sites/covid19/Pages/dashboard-cases.aspx

The scary red line is the CUMULATIVE NUMBER OF COVID-19 DEATHS which is guaranteed to never decrease even if the disease disappears. It is NOT the number of daily deaths or a smoothed average of the number of daily deaths, an easy mistake when viewing graphs of this type. This means a total of 503 official COVID-19 deaths since the beginning of 2020.

Santa Clara County has a population of about 1.9 million people in 2019 according to the US Census with 10,889 total deaths in 2015, the last year for which I could find an exact death count, according to the Office of the Medical Examiner-Coroner for the County of Santa Clara. The most recent estimated death rate for the United States in 2018 was 867.8 deaths per 100,000 people according the US Centers for Disease Control. One point nine million (1.9 million) is nineteen (19) times 100,000. This means an estimated number of deaths in Santa Clara County of nineteen (19) times 867.8 or 16,488 expected deaths in 2020 from all causes.

What percentage of these 16,488 expected deaths would be attributed to pneumonia and influenza in pre-COVID-19 years (2019 and earlier)? The CDC FluView web site shows that six to ten percent of deaths, varying seasonally, are due to pneumonia and influenza (P&I) according to the vertical axis label on the FluView Pneumonia & Influenza Mortality plot, meaning at least six percent of the deaths or 989 deaths would be due to pneumonia and influenza.

US Centers for Disease Control (CDC) FluView Pneumonia & Influenza Mortality Plot (Dec. 4, 2020)

NOTE: https://www.cdc.gov/flu/weekly/fluviewinteractive.htm and click on P&I Mortality Tab

In contrast, the CDC’s leading causes of death report Table C, Deaths and percentage of total deaths for the 10 leading causes of death: United States, 2016 and 2017 on Page Nine (see screenshot below) attributes only two percent of annual deaths (about 55,000 in 2017) to “influenza and pneumonia.” If this smaller number is used, we would expect about 329 deaths from pneumonia and influenza in 2020.

The difference between the CDC FluView and leading causes of death report numbers is probably due to the requirement that pneumonia or influenza be listed as “the underlying cause of death” in the leading causes of death report and only “a cause of death” in the FluView data. This is not clear. Many deaths have multiple “causes of death.” The assignment of an “underlying cause of death” may be quite arbitrary in some cases. Despite this, none of these official numbers either in the leading causes of death report or the FluView web site are reported with error bars or error estimates as required by common scientific and engineering practice when numbers are uncertain.

Screenshots of the official CDC, Santa Clara County, and US Census web sites used for these numbers from Friday, December 4, 2020:

Santa Clara County Total Reported Deaths from 2000 to 2015
Santa Clara County Population from US Census Bureau
US Centers for Disease Control (CDC) FluView Pneumonia and Influenza Mortality Plots (Dec. 4, 2020)
United States National Death Rate According to US CDC (Dec. 4, 2020)
US CDC Leading Causes of Death Report Attributes Only About Two Percent of All Deaths to Pneumonia and Influenza (Line Item 8: Influenza and Pneumonia) — not the Six to Ten Percent in the FluView Graphs

Remarkably the total number of deaths (503) attributed to COVID-19 in Santa Clara County is clearly within the range of deaths expected from pneumonia and influenza (329 to 989) based on historical data prior to 2020.

Santa Clara County Has Close Ties to China

Santa Clara County, home to Apple, Google, and many other companies with extensive manufacturing operations in China, the presumed source of the Sars-COV-2 virus, and large numbers of direct and contract employees again from China (mainland China), has extensive ties to China, meaning mainland China, not just Taiwan, Singapore, Hong Kong, and other ethnically Chinese nations and communities outside of China proper. Indeed, it probably has the closest ties, travel and trade to and from China of any region in the United States — likely much more than the New York and New Jersey region where the most deaths and highest death rates have been reported. One would expect Santa Clara County, California to have the earliest and largest cumulative number of deaths from COVID-19 in the United States.

According to the New York Times (April 4, 2020), at least 430,000 people returned to the United States from China after the Sars-COV-2 virus appeared, many after President Trump’s travel ban. A large fraction of these probably returned to Santa Clara County given the close ties between China and Santa Clara County. According to the San Francisco Chronicle, the first US COVID case was a 57-year old woman who passed away at home on February 6, 2020, well before the Kirkland Life Care Center cases in late February.

Many Seeming Routes for Rapid Spread of the Disease

Santa Clara County continues to authorize many luxury apartment and other construction projects with teams of workers in close proximity five full days per week, after a brief 3-4 week shutdown in May — several weeks after the original lockdown order. On a personal note, a four-story luxury apartment building construction project with at least a dozen workers every weekday from about 7:30 am to 4:30 pm has continued across the street from my apartment building since the original lockdown order except for the brief shutdown in May.

Santa Clara County Allows Construction Projects Despite COVID-19
Over a Dozen Construction Workers Arriving for Work on Luxury Apartment Project in Santa Clara County, CA (August 6, 2020)
Construction Workers in Close Proximity (Santa Clara County, Dec. 7, 2020)

The lockdown continues to herd large numbers of citizens in Santa Clara County into a few gigantic stores such as Safeway, Walmart, and Target, enabling what would seem like an efficient route for rapid spread of the disease.

Safeway with Over Thirty Cars in Parking Lot (about 9:30 AM, December 7, 2020, Santa Clara County)

UPDATE (Dec. 9, 2020): These giant “Big Box” retail stores have heavily used shared spaces and surfaces where one would expect the virus will rapidly spread. These include the entry/exit door areas, checkout counters, and refrigerators with popular products such as milk purchased by a large fraction of the customers and with door handles that all purchasers must use. These large stores often have hundreds of patrons in the store at the same time — all day, seven days per week.

Milk and other dairy products in a refrigerator with door handle that customers must use

In Santa Clara County, the lockdowns have closed or heavily curtailed restaurants, popular with the large population of single people and leading to a large increase in demand for microwave dinners often found in store refrigerators with door handles that must be used by the customers.

Microwave dinners in store refrigerator with door handle that customers must use

Several other specific scenarios exist for rapid efficient spread of the virus through these giant retail stores.

UPDATE (Dec. 6, 2020): Santa Clara County also has a bus service, the VTA or Valley Transportation Authority, in widespread use with patrons, often “essential workers,” sharing an enclosed space and seats.

VTA Bus in Operation on December 7, 2020, Santa Clara County, California

UPDATE (Dec. 7, 2020) The lockdown shelter in place and stay at home orders confine “non-essential workers” to numerous generally large apartment complexes, often with hundreds of tenants, possibly thousands in some cases. In Mountain View, California — site of Google’s headquarters — about fifty-eight percent of residents (Town Charts, see Figure 5) are renters, most in large complexes. These complexes feature shared trash chutes/rooms, laundry rooms, hallways and lobbies with exterior doors and fire doors that must be opened by hand in most cases, providing many shared surfaces and spaces for spread of the virus.

Typical Trash Chute Room with Fire Door in Santa Clara County — Note Door Handle (December 7, 2020)
Typical Trash Room Interior with Trash Chute (Note Handle) in Santa Clara County (December 7, 2020)
Typical Laundry Room Door with Handle in Santa Clara County (December 7, 2020)

Note that fire regulations require closely spaced closed fire doors in the interior hallways — with handles or knobs that all residents must use to open the fire doors.

The large apartment complexes common in Santa Clara County provide numerous shared spaces where aerosol virus particles can collect and linger in the air as well as shared surfaces such as door handles that all residents must touch.

Gloves are not required. Gloves would have to be handled carefully and sterilized before and after each or nearly each use to avoid spreading the virus, something probably impractical and certainly currently NOT done by most residents.

In general, the apartment complex support staff cannot clean each door handle after each use. The shared support staff themselves are a high risk of both becoming infected and spreading the infection to other residents. Almost none have training or experience in bio-safety measures.

These shared spaces and surfaces are enclosed, protected from exterior wind that can disperse the virus particles and from the ultraviolet component of sunlight which can destroy the virus particles outside. By design, the required fire doors limit air flow in the buildings to prevent a disastrous fire. Citizens are being mandated/encouraged to spend most of their time inside in these complexes.

Conclusion

As of December 4, 2020, the total and daily death numbers for COVID-19 continue to deviate sharply from both hyperbolic headlines and reasonable expectations — as was the case in March and April of 2020. Indeed, the total number of official reported COVID-19 deaths to date (503 on Dec. 4, 2020) remains small enough to be consistent with no new or unusual disease causing more deaths than normal in Santa Clara County in 2020.

(C) 2020 by John F. McGowan, Ph.D.

About Me

John F. McGowan, Ph.D. solves problems using mathematics and mathematical software, including developing gesture recognition for touch devices, video compression and speech recognition technologies. He has extensive experience developing software in C, C++, MATLAB, Python, Visual Basic and many other programming languages. He has been a Visiting Scholar at HP Labs developing computer vision algorithms and software for mobile devices. He has worked as a contractor at NASA Ames Research Center involved in the research and development of image and video processing algorithms and technology. He has published articles on the origin and evolution of life, the exploration of Mars (anticipating the discovery of methane on Mars), and cheap access to space. He has a Ph.D. in physics from the University of Illinois at Urbana-Champaign and a B.S. in physics from the California Institute of Technology (Caltech).

[Video] Why are the CDC’s Grossly Contradictory Death Numbers Important to the US Election?

Why are the CDC’s Grossly Contradictory Death Numbers Important to the US Election?

A short video explaining WHY the contradictory pneumonia and influenza death numbers on the CDC web site and official documents are critically important to the US Presidential Election. The FluView web site claims six to ten percent of all deaths are pneumonia and influenza in a prominently displayed graphic. However, the Leading Causes of Death report claims about two percent of deaths are caused by pneumonia and influenza, less than one third of the percentages reported on the FluView web site.

Looking at the numbers behind the percentages. The CDC uses two grossly contradictory numbers of annual deaths from pneumonia and influenza: about 55,000 in the annual leading causes of the death report and about 188,000 in National Center for Health Statistics (NCHS) data used on the FluView web site to report the percentage of deaths each week due to pneumonia and influenza. These differ by a factor of OVER THREE. The larger FluView number is comparable to the current cumulative total COVID-19 deaths in the United States frequently cited by the media and compared to a smaller number of about 40,000 “flu deaths” which is similar to the smaller number of “pneumonia and influenza” deaths in the leading causes of death report.

The most recent raw data appears to still be accessible on the FluView Pneumonia and Influenza Mortality web page:

https://www.cdc.gov/flu/weekly/index.htm (see Pneumonia and Influenza Mortality Section)

FluView NCHS Raw Data File: https://www.cdc.gov/flu/weekly/weeklyarchives2019-2020/data/NCHSData34.csv

Leading Causes of Death Full Report: https://www.cdc.gov/nchs/data/nvsr/nvsr68/nvsr68_06-508.pdf

See Table C: Deaths and percentage of total deaths for the 10 leading causes of death: United States, 2016 and 2017 (Page 9 of PDF)

Line item 8 “Influenza and pneumonia” lists 55,672 deaths in 2017

Avoid Internet Censorship by Subscribing to Our RSS News Feed: http://wordpress.jmcgowan.com/wp/feed/

Legal Disclaimers: http://wordpress.jmcgowan.com/wp/legal/

Support Us:
PATREON: https://www.patreon.com/mathsoft
SubscribeStar: https://www.subscribestar.com/mathsoft

Subscribers gain access to the advanced professional features of our censored search web site and service — censored-search.com — a search engine for censored Internet content banned or shadow-banned by increasingly censored, advertising beholden social media and search engines such as Google, YouTube, and Facebook. The free version of censored-search.com — available to all — uses a modified page rank algorithm, essentially a popularity contest. The paid professional version includes advanced search algorithms to find and prioritize content that is probably being censored by vested interests because it is useful and true — for example, evidence that a product or service is harmful to users.

BitChute (Video): https://www.bitchute.com/channel/HGgoa2H3WDac/
Brighteon (Video): https://www.brighteon.com/channels/mathsoft
LBRY (Video): https://lbry.tv/@MathematicalSoftware:5

(C) 2020 by John F. McGowan, Ph.D.

About Me

John F. McGowan, Ph.D. solves problems using mathematics and mathematical software, including developing gesture recognition for touch devices, video compression and speech recognition technologies. He has extensive experience developing software in C, C++, MATLAB, Python, Visual Basic and many other programming languages. He has been a Visiting Scholar at HP Labs developing computer vision algorithms and software for mobile devices. He has worked as a contractor at NASA Ames Research Center involved in the research and development of image and video processing algorithms and technology. He has published articles on the origin and evolution of life, the exploration of Mars (anticipating the discovery of methane on Mars), and cheap access to space. He has a Ph.D. in physics from the University of Illinois at Urbana-Champaign and a B.S. in physics from the California Institute of Technology (Caltech).