Another Skeptical Look at STEM Shortage Numbers

College STEM Degrees (NSF Science and Engineering Indicators 2018)

It is common to encounter claims of a “desperate” or “severe” shortage of STEM (Science, Technology, Engineering, and Mathematics) workers, either current or projected, usually from employers of STEM workers. These claims are perennial and date back at least to the 1940’s after World War II despite the huge number of STEM workers employed in wartime STEM projects (the Manhattan Project that developed the atomic bomb, military radar, code breaking machines and computers, the B-29 and other high tech bombers, the development of penicillin, K-rations, etc.). This article takes a look at the STEM degree numbers in the National Science Foundation’s Science and Engineering Indicators 2018 report.
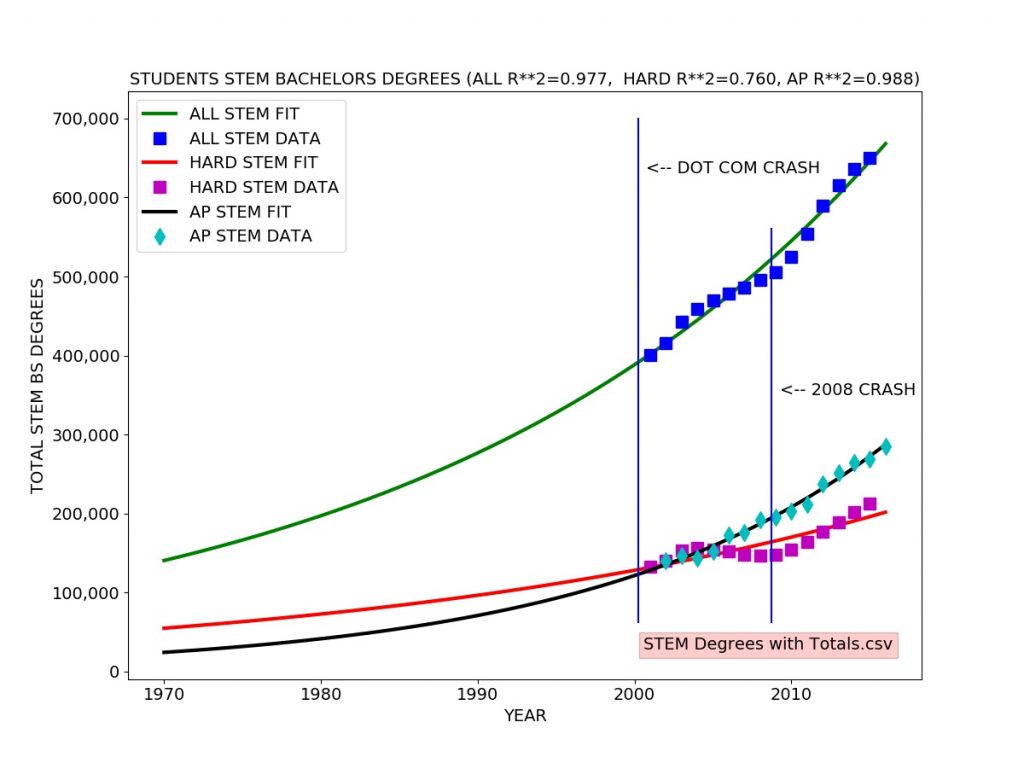
College STEM Degrees (NSF Science and Engineering Indicators 2018)

I looked at the total Science and Engineering bachelors degrees granted each year which includes degrees in Social Science, Psychology, Biological and agricultural sciences as well as hard core Engineering, Computer Science, Mathematics, and Physical Sciences. I also looked specifically at the totals for “hard” STEM degrees (Engineering, Computer Science, Mathematics, and Physical Sciences). I also included the total number of K-12 students who pass (score 3,4, or 5 out of 5) on the Advanced Placement (AP) Calculus Exam (either the AB exam or the more advanced BC exam) each year.

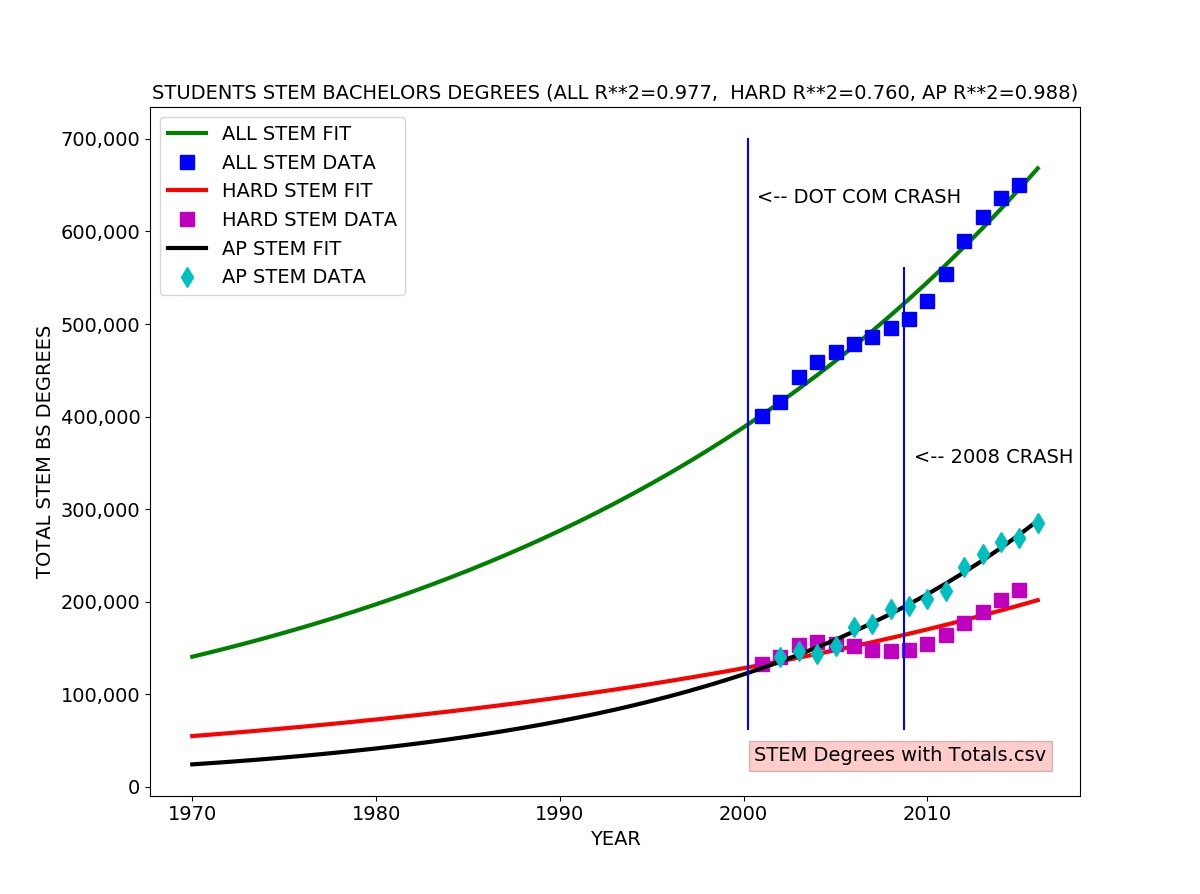
I fitted an exponential growth model to each data series. The exponential growth model fits well to the total STEM degrees and AP passing data. The exponential growth model roughly agrees with the hard STEM degree data, but there is a clear difference, reflected in the coefficient of determination (R-SQUARED) of 0.76 meaning the model explains about 76 percent of the variation in the data.

One can easily see the the number of hard STEM degrees significantly exceeds the trend line in the early 00’s (2000 to about 2004) and drops well below from 2004 to 2008, rebounding in 2008. This probably reflects the surge in CS degrees specifically due to the Internet/dot com bubble (1995-2001).

There appears to be a lag of about four years between the actual dot com crash usually dated to a stock market drop in March of 2000 and the drop in production of STEM bachelor’s degrees in about 2004.

Analysis results:

TOTAL Scientists and Engineers 2016: 6,900,000

ALL STEM Bachelor's Degrees
ESTIMATED TOTAL IN 2016 SINCE 1970: 15,970,052
TOTAL FROM 2001 to 2015 (Science and Engineering Indicators 2018)  7,724,850
ESTIMATED FUTURE STUDENTS (2016 to 2026): 8,758,536
ANNUAL GROWTH RATE:  3.45 %  US POPULATION GROWTH RATE (2016): 0.7 %

HARD STEM DEGREES ONLY (Engineering, Physical Sciences, Math, CS)
ESTIMATED TOTAL IN 2016 SINCE 1970: 5,309,239
TOTAL FROM 2001 to 2015 (Science and Engineering Indicators 2018)  2,429,300
ESTIMATED FUTURE STUDENTS (2016 to 2026): 2,565,802
ANNUAL GROWTH RATE:  2.88 %  US POPULATION GROWTH RATE (2016): 0.7 %

STUDENTS PASSING AP CALCULUS EXAM
ESTIMATED TOTAL IN 2016 SINCE 1970: 5,045,848
TOTAL FROM 2002 to 2016  (College Board)  3,038,279
ESTIMATED FUTURE STUDENTS (2016 to 2026): 4,199,602
ANNUAL GROWTH RATE:  5.53 %  US POPULATION GROWTH RATE (2016): 0.7 %
estimate_college_stem.py ALL DONE

The table below gives the raw numbers from Figure 02-10 in the NSF Science and Engineering Indicators 2018 report with a column for total STEM degrees and a column for total STEM degrees in hard science and technology subjects (Engineering, Computer Science, Mathematics, and Physical Sciences) added for clarity:
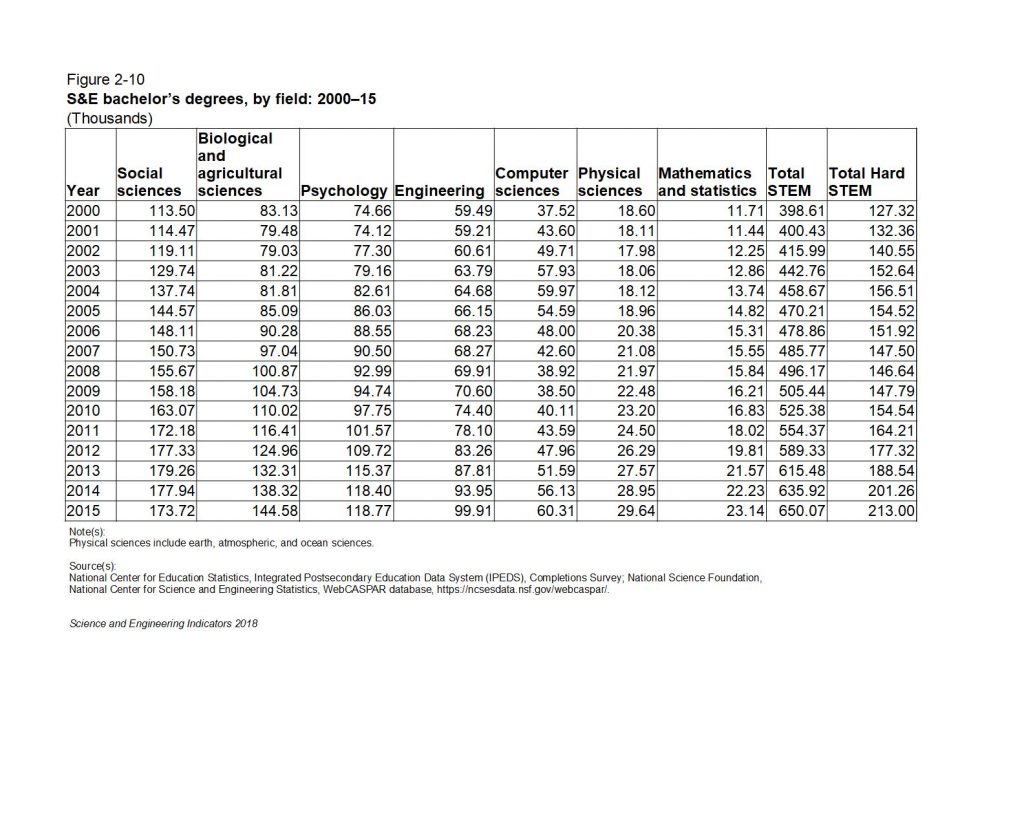
STEM Degrees Table fig02-10 Revised

In the raw numbers, we see steady growth in social science and psychology STEM degrees from 2000 to 2015 with no obvious sign of the Internet/dot com bubble. There is a slight drop in Biological and agricultural sciences degrees in the early 00s. Somewhat larger drops can be seen in Engineering and Physical Sciences degrees in the early 00’s as well as a concomittant sharp rise in Computer Science (CS) degrees. This probably reflects strong STEM students shifting into CS degrees.

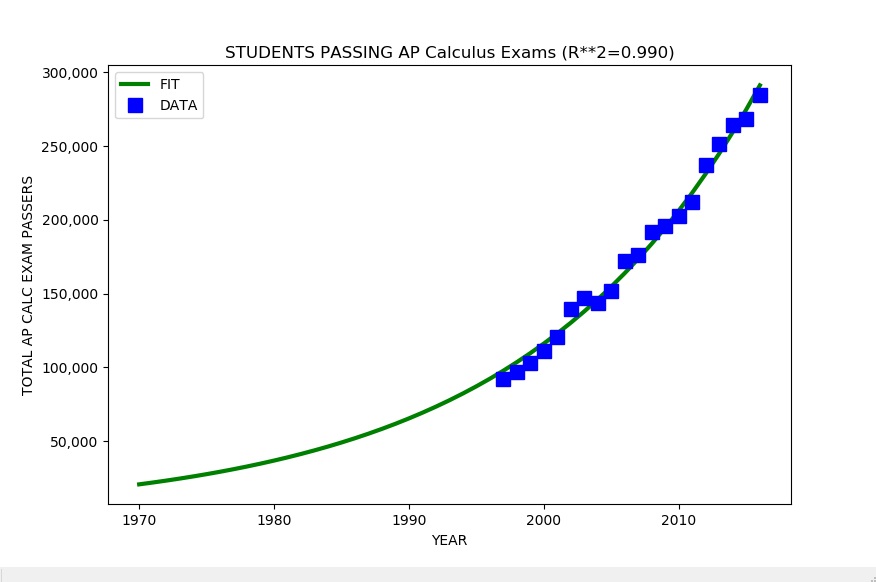
The number of K-12 students taking and passing the AP Calculus Exam (either the AB or more advanced BC exam) grows continuously and rapidly during the entire period from 1997 to 2016, growing at over five percent per year, far above the United States population growth rate of 0.7 percent per year.

The number of college students earning hard STEM degrees appears to be slightly smaller than the four year lagged number of K-12 students passing the AP exam, suggesting some attrition of strong STEM students at the college level. We might expect the number of hard STEM bachelors degrees granted each year to be the same or very close to the number of AP Exam passing students four years earlier.

A model using only the hard STEM bachelors degree students gives a total number of STEM college students produced since 1970 of five million, pretty close to the number of K-12 students estimated from the AP Calculus exam data. This is somewhat less than the 6.9 million total employed STEM workers estimated by the United States Bureau of Labor Statistics.

Including all STEM degrees gives a huge surplus of STEM students/workers, most not employed in a STEM field as reported by the US Census and numerous media reports.

The hard STEM degree model predicts about 2.5 million new STEM workers graduating between 2016 and 2026. This is slightly more than the number of STEM job openings seemingly predicted by the Bureau of Labor Statistics (about 800,000 new STEM jobs and about 1.5 million retirements and deaths of current aging STEM workers giving a total of about 2.3 million “new” jobs). The AP student model predicts about 4 million new STEM workers, far exceeding the BLS predictions and most other STEM employment predictions.

The data and models do not include the effects of immigration and guest worker programs such as the controversial H1-B visa, L1 visa, OPT visa, and O (“Genius”) visa. Immigrants and guest workers play an outsized role in the STEM labor force and specifically in the computer science/software labor force (estimated at 3-4 million workers, over half of the STEM labor force).

Difficulty of Evaluating “Soft” STEM Degrees

Social science, psychology, biological and agricultural sciences STEM degrees vary widely in rigor and technical requirements. The pioneering statistician Ronald Fisher developed many of his famous methods as an agricultural researcher at the Rothamsted agricultural research institute. The leading data analysis tool SAS from the SAS Institute was originally developed by agricultural researchers at North Carolina State University. IBM’s SPSS (Statistics Package for Social Sciences) data analysis tool, number three in the market, was developed for social sciences. Many “hard” sciences such as experimental particle physics use methods developed by Fisher and other agricultural and social scientists. Nonetheless, many “soft” science STEM degrees do not involve the same level of quantitative, logical, and programming skills typical of “hard” STEM fields.

In general, STEM degrees at the college level are not highly standardized. There is no national or international standard test or tests comparable to the AP Calculus exams at the K-12 level to get a good national estimate of the number of qualified students.

The numbers suggest but do not prove that most K-12 students who take and pass AP Calculus continue on to hard STEM degrees or some type of rigorous biology or agricultural sciences degree — hence the slight drop in biology and agricultural science degrees during the dot com bubble period with students shifting to CS degrees.

Conclusion

Both the college “hard” STEM degree data and the K-12 AP Calculus exam data strongly suggest that the United States can and will produce more qualified STEM students than job openings predicted for the 2016 to 2026 period. Somewhat more according to the college data, much more according to the AP exam data, and a huge surplus if all STEM degrees including psychology and social science are considered. The data and models do not include the substantial number of immigrants and guest workers in STEM jobs in the United States.

NOTE: The raw data in text CSV (comma separated values) format and the Python analysis program are included in the appendix below.

(C) 2018 by John F. McGowan, Ph.D.

About Me

John F. McGowan, Ph.D. solves problems using mathematics and mathematical software, including developing gesture recognition for touch devices, video compression and speech recognition technologies. He has extensive experience developing software in C, C++, MATLAB, Python, Visual Basic and many other programming languages. He has been a Visiting Scholar at HP Labs developing computer vision algorithms and software for mobile devices. He has worked as a contractor at NASA Ames Research Center involved in the research and development of image and video processing algorithms and technology. He has published articles on the origin and evolution of life, the exploration of Mars (anticipating the discovery of methane on Mars), and cheap access to space. He has a Ph.D. in physics from the University of Illinois at Urbana-Champaign and a B.S. in physics from the California Institute of Technology (Caltech).

Appendix: Source Code and Raw Data

AP Calculus Totals.csv

Year,Total
2016.0,284750.0
2015.0,268316.0
2014.0,264023.0
2013.0,251354.0
2012.0,237184.0
2011.0,211890.0
2010.0,202336.0
2009.0,195667.0
2008.0,191664.0
2007.0,176072.0
2006.0,172396.0
2005.0,151935.0
2004.0,143779.0
2003.0,146996.0
2002.0,139917.0

STEM Degrees with Totals.csv

Year,Social sciences,Biological and agricultural sciences,Psychology,Engineering,Computer sciences,Physical sciences,Mathematics and statistics,Total STEM,Total Hard STEM
2000,113.50,83.13,74.66,59.49,37.52,18.60,11.71,398.61,127.32
2001,114.47,79.48,74.12,59.21,43.60,18.11,11.44,400.43,132.36
2002,119.11,79.03,77.30,60.61,49.71,17.98,12.25,415.99,140.55
2003,129.74,81.22,79.16,63.79,57.93,18.06,12.86,442.76,152.64
2004,137.74,81.81,82.61,64.68,59.97,18.12,13.74,458.67,156.51
2005,144.57,85.09,86.03,66.15,54.59,18.96,14.82,470.21,154.52
2006,148.11,90.28,88.55,68.23,48.00,20.38,15.31,478.86,151.92
2007,150.73,97.04,90.50,68.27,42.60,21.08,15.55,485.77,147.50
2008,155.67,100.87,92.99,69.91,38.92,21.97,15.84,496.17,146.64
2009,158.18,104.73,94.74,70.60,38.50,22.48,16.21,505.44,147.79
2010,163.07,110.02,97.75,74.40,40.11,23.20,16.83,525.38,154.54
2011,172.18,116.41,101.57,78.10,43.59,24.50,18.02,554.37,164.21
2012,177.33,124.96,109.72,83.26,47.96,26.29,19.81,589.33,177.32
2013,179.26,132.31,115.37,87.81,51.59,27.57,21.57,615.48,188.54
2014,177.94,138.32,118.40,93.95,56.13,28.95,22.23,635.92,201.26
2015,173.72,144.58,118.77,99.91,60.31,29.64,23.14,650.07,213.00

estimate_college_stem.py

#
#  Estimate the total production of STEM students at the
#  College level from BS degrees granted (United States)
#
#  (C) 2018 by John F. McGowan, Ph.D. (ceo@mathematical-software.com)
#

# Python standard libraries
import os
import sys
import time

# Numerical/Scientific Python libraries
import numpy as np
import scipy.optimize as opt  # curve_fit()
import pandas as pd  # reading text CSV files etc.

# Graphics
import matplotlib.pyplot as plt
import matplotlib.ticker as ticker
from mpl_toolkits.mplot3d import Axes3D

# customize fonts
SMALL_SIZE = 8
MEDIUM_SIZE = 10
LARGE_SIZE = 12
XL_SIZE = 14
XXL_SIZE = 16

plt.rc('font', size=XL_SIZE)          # controls default text sizes
plt.rc('axes', titlesize=XL_SIZE)     # fontsize of the axes title
plt.rc('axes', labelsize=XL_SIZE)     # fontsize of the x and y labels
plt.rc('xtick', labelsize=XL_SIZE)    # fontsize of the tick labels
plt.rc('ytick', labelsize=XL_SIZE)    # fontsize of the tick labels
plt.rc('legend', fontsize=XL_SIZE)    # legend fontsize
plt.rc('figure', titlesize=XL_SIZE)   # fontsize of the figure title

# STEM Bachelors Degrees earned by year (about 2000 to 2015)
#
# data from National Science Foundation (NSF)/ National Science Board
# Science and Engineering Indicators 2018 Report
# https://www.nsf.gov/statistics/2018/nsb20181/
# Figure 02-10
#
input_file = "STEM Degrees with Totals.csv"

if len(sys.argv) > 1:
    index = 1
    while index < len(sys.argv):
        if sys.argv[index] in ["-i", "-input"]:
            input_file = sys.argv[index+1]
            index += 1
        elif sys.argv[index] in ["-h", "--help", "-help", "-?"]:
            print("Usage:", sys.argv[0], " -i input_file='AP Calculus Totals by Year.csv'")
            sys.exit(0)
        index +=1

print(__file__, "started", time.ctime())  # time stamp
print("Processing data from: ", input_file)

# read text CSV file (exported from spreadsheet)
df = pd.read_csv(input_file)

# drop NaNs for missing values in Pandas
df.dropna()

# get number of students who pass AP Calculus Exam (AB or BC)
# each year
df_ap_pass = pd.read_csv("AP Calculus Totals.csv")
ap_year = df_ap_pass.values[:,0]
ap_total = df_ap_pass.values[:,1] 

# numerical data
hard_stem_str = df.values[1:,-1] # engineering, physical sciences, math/stat, CS
all_stem_str = df.values[1:,-2]  # includes social science, psychology, agriculture etc.

hard_stem = np.zeros(hard_stem_str.shape)
all_stem = np.zeros(all_stem_str.shape)

for index, val in enumerate(hard_stem_str.ravel()):
    if isinstance(val, str):
        hard_stem[index] = np.float(val.replace(',',''))
    elif isinstance(val, (float, np.float)):
        hard_stem[index] = val
    else:
        raise TypeError("unsupported type " + str(type(val)))

for index, val in enumerate(all_stem_str.ravel()):
    if isinstance(val, str):
        all_stem[index] = np.float(val.replace(',', ''))
    elif isinstance(val, (float, np.float)):
        all_stem[index] = val
    else:
        raise TypeError("unsupported type " + str(type(val)))

DEGREES_PER_UNIT = 1000
# units are thousands of degrees granted 
all_stem = DEGREES_PER_UNIT*all_stem
hard_stem = DEGREES_PER_UNIT*hard_stem
    
years_str = df.values[1:,0]
years = np.zeros(years_str.shape)
for index, val in enumerate(years_str.ravel()):
    years[index] = np.float(val)

# almost everyone in the labor force graduated since 1970
# someone 18 years old in 1970 is 66 today (2018)
START_YEAR = 1970

def my_exp(x, *p):
    """
    exponential model for curve_fit(...)
    """
    return p[0]*np.exp(p[1]*(x - START_YEAR))

# starting guess for model parameters
p_start = [ 50000.0, 0.01 ]

# fit all STEM degree data
popt, pcov = opt.curve_fit(my_exp, years, all_stem, p_start)

# fit hard STEM degree data
popt_hard_stem, pcov_hard_stem = opt.curve_fit(my_exp, \
                                               years, \
                                               hard_stem, \
                                               p_start)
# fit AP Students data
popt_ap, pcov_ap = opt.curve_fit(my_exp, \
                                 ap_year, \
                                 ap_total, \
                                 p_start)

print(popt)  # sanity check

STOP_YEAR = 2016
NYEARS = (STOP_YEAR - START_YEAR + 1)

years_fit = np.linspace(START_YEAR, STOP_YEAR, NYEARS)
n_fit = my_exp(years_fit, *popt)

n_pred = my_exp(years, *popt)

r2 = 1.0 - (n_pred - all_stem).var()/all_stem.var()
r2_str = "%4.3f" % r2

n_fit_hard = my_exp(years_fit, *popt_hard_stem)
n_pred_hard = my_exp(years, *popt_hard_stem)

r2_hard = 1.0 - (n_pred_hard - hard_stem).var()/hard_stem.var()
r2_hard_str = "%4.3f" % r2_hard

n_fit_ap = my_exp(years_fit, *popt_ap)
n_pred_ap = my_exp(ap_year, *popt_ap)

r2_ap = 1.0 - (n_pred_ap - ap_total).var()/ap_total.var()
r2_ap_str = "%4.3f" % r2_ap


cum_all_stem = n_fit.sum()
cum_hard_stem = n_fit_hard.sum()
cum_ap_stem = n_fit_ap.sum()

# to match BLS projections
future_years = np.linspace(2016, 2026, 11)

assert future_years.size == 11  # sanity check

future_students = my_exp(future_years, *popt)
future_students_hard = my_exp(future_years, *popt_hard_stem)
future_students_ap = my_exp(future_years, *popt_ap)

# https://fas.org/sgp/crs/misc/R43061.pdf
#
# The U.S. Science and Engineering Workforce: Recent, Current,
# and Projected Employment, Wages, and Unemployment
#
# by John F. Sargent Jr.
# Specialist in Science and Technology Policy
# November 2, 2017
#
# Congressional Research Service 7-5700 www.crs.gov R43061
#
# "In 2016, there were 6.9 million scientists and engineers (as
# defined in this report) employed in the United States, accounting
# for 4.9 % of total U.S. employment."
#

# BLS astonishing/bizarre projections for 2016-2026

# "The Bureau of Labor Statistics (BLS) projects that the number of S&E
# jobs will grow by 853,600 between 2016 and 2026 , a growth rate
# (1.1 % CAGR) that is somewhat faster than that of the overall
# workforce ( 0.7 %). In addition, BLS projects that 5.179 million
# scientists and engineers will be needed due to labor force exits and
# occupational transfers (referred to collectively as occupational
# separations ). BLS projects the total number of openings in S&E due to growth ,
# labor force exits, and occupational transfers between 2016 and 2026 to be
# 6.033 million, including 3.477 million in the computer occupations and
# 1.265 million in the engineering occupations."

# NOTE: This appears to project 5.170/6.9 or 75 percent!!!! of current STEM
# labor force LEAVE THE STEM PROFESSIONS by 2026!!!!

# "{:,}".format(value) to specify the comma separated thousands format
#
print("TOTAL Scientists and Engineers 2016:", "{:,.0f}".format(6.9e6))
# ALL STEM
print("\nALL STEM Bachelor's Degrees")
print("ESTIMATED TOTAL IN 2016 SINCE ", START_YEAR, ": ", \
      "{:,.0f}".format(cum_all_stem), sep='')
# don't use comma grouping for years
print("TOTAL FROM", "{:.0f}".format(years_str[0]), \
      "to 2015 (Science and Engineering Indicators 2018) ", \
      "{:,.0f}".format(all_stem.sum()))
print("ESTIMATED FUTURE STUDENTS (2016 to 2026):", \
      "{:,.0f}".format(future_students.sum()))
# annual growth rate of students taking AP Calculus
growth_rate_pct = (np.exp(popt[1]) - 1.0)*100

print("ANNUAL GROWTH RATE: ", "{:,.2f}".format(growth_rate_pct), \
      "%  US POPULATION GROWTH RATE (2016): 0.7 %")

# HARD STEM

print("\nHARD STEM DEGREES ONLY (Engineering, Physical Sciences, Math, CS)")
print("ESTIMATED TOTAL IN 2016 SINCE ", START_YEAR, ": ", \
      "{:,.0f}".format(cum_hard_stem), sep='')
# don't use comma grouping for years
print("TOTAL FROM", "{:.0f}".format(years_str[0]), \
      "to 2015 (Science and Engineering Indicators 2018) ", \
      "{:,.0f}".format(hard_stem.sum()))
print("ESTIMATED FUTURE STUDENTS (2016 to 2026):", \
      "{:,.0f}".format(future_students_hard.sum()))
# annual growth rate of students taking AP Calculus
growth_rate_pct_hard = (np.exp(popt_hard_stem[1]) - 1.0)*100

print("ANNUAL GROWTH RATE: ", "{:,.2f}".format(growth_rate_pct_hard), \
      "%  US POPULATION GROWTH RATE (2016): 0.7 %")


# AP STEM -- Students passing AP Calculus Exam Each Year 

print("\nSTUDENTS PASSING AP CALCULUS EXAM")
print("ESTIMATED TOTAL IN 2016 SINCE ", START_YEAR, ": ", \
      "{:,.0f}".format(cum_ap_stem), sep='')
# don't use comma grouping for years
print("TOTAL FROM", "{:.0f}".format(ap_year[-1]), \
      "to", "{:.0f}".format(ap_year[0])," (College Board) ", \
      "{:,.0f}".format(ap_total.sum()))
print("ESTIMATED FUTURE STUDENTS (2016 to 2026):", \
      "{:,.0f}".format(future_students_ap.sum()))
# annual growth rate of students taking AP Calculus
growth_rate_pct_ap = (np.exp(popt_ap[1]) - 1.0)*100

print("ANNUAL GROWTH RATE: ", "{:,.2f}".format(growth_rate_pct_ap), \
      "%  US POPULATION GROWTH RATE (2016): 0.7 %")


# US Census reports 0.7 percent annual growth of US population in 2016
# SOURCE: https://www.census.gov/newsroom/press-releases/2016/cb16-214.html
#

f1 = plt.figure(figsize=(12,9))
ax = plt.gca()
# add commas to tick values (e.g. 1,000 instead of 1000)
ax.get_yaxis().set_major_formatter(
    ticker.FuncFormatter(lambda x, p: format(int(x), ',')))

DOT_COM_CRASH = 2000.25  # usually dated march 10, 2000
OCT_2008_CRASH = 2008.75 # usually dated October 11, 2008
DELTA_LABEL_YEARS = 0.5

plt.plot(years_fit, n_fit, 'g', linewidth=3, label='ALL STEM FIT')
plt.plot(years, all_stem, 'bs', markersize=10, label='ALL STEM DATA')
plt.plot(years_fit, n_fit_hard, 'r', linewidth=3, label='HARD STEM FIT')
plt.plot(years, hard_stem, 'ms', markersize=10, label='HARD STEM DATA')
plt.plot(years_fit, n_fit_ap, 'k', linewidth=3, label='AP STEM FIT')
plt.plot(ap_year, ap_total, 'cd', markersize=10, label='AP STEM DATA')
[ylow, yhigh] = plt.ylim()
dy = yhigh - ylow
# add marker lines for crashes
plt.plot((DOT_COM_CRASH, DOT_COM_CRASH), (ylow+0.1*dy, yhigh), 'b-')
plt.text(DOT_COM_CRASH + DELTA_LABEL_YEARS, 0.9*yhigh, '<-- DOT COM CRASH')
# plt.arrow(...) add arrow (arrow does not render correctly)

plt.plot((OCT_2008_CRASH, OCT_2008_CRASH), (ylow+0.1*dy, 0.8*yhigh), 'b-')
plt.text(OCT_2008_CRASH+DELTA_LABEL_YEARS, 0.5*yhigh, '<-- 2008 CRASH')
plt.legend()
plt.title('STUDENTS STEM BACHELORS DEGREES (ALL R**2=' \
          + r2_str + ',  HARD R**2=' + r2_hard_str + \
          ', AP R**2=' + r2_ap_str + ')')
plt.xlabel('YEAR')
plt.ylabel('TOTAL STEM BS DEGREES')
# appear to need to do this after the plots
# to get valid ranges
[xlow, xhigh] = plt.xlim()
[ylow, yhigh] = plt.ylim()
dx = xhigh - xlow
dy = yhigh - ylow
# put input data file name in lower right corner
plt.text(xlow + 0.65*dx, \
         ylow + 0.05*dy, \
         input_file, \
         bbox=dict(facecolor='red', alpha=0.2))

plt.show()

f1.savefig('College_STEM_Degrees.jpg')

print(__file__, "ALL DONE")

Video Commentary on Better K-12 STEM Student Numbers

AP Calculus Model Revised 1997 to 2016 Data


(C) 2018 by John F. McGowan, Ph.D.

About Me

John F. McGowan, Ph.D. solves problems using mathematics and mathematical software, including developing gesture recognition for touch devices, video compression and speech recognition technologies. He has extensive experience developing software in C, C++, MATLAB, Python, Visual Basic and many other programming languages. He has been a Visiting Scholar at HP Labs developing computer vision algorithms and software for mobile devices. He has worked as a contractor at NASA Ames Research Center involved in the research and development of image and video processing algorithms and technology. He has published articles on the origin and evolution of life, the exploration of Mars (anticipating the discovery of methane on Mars), and cheap access to space. He has a Ph.D. in physics from the University of Illinois at Urbana-Champaign and a B.S. in physics from the California Institute of Technology (Caltech).

Better Numbers on K-12 STEM Student Production

AP Calculus Model Revised 1997 to 2016 Data

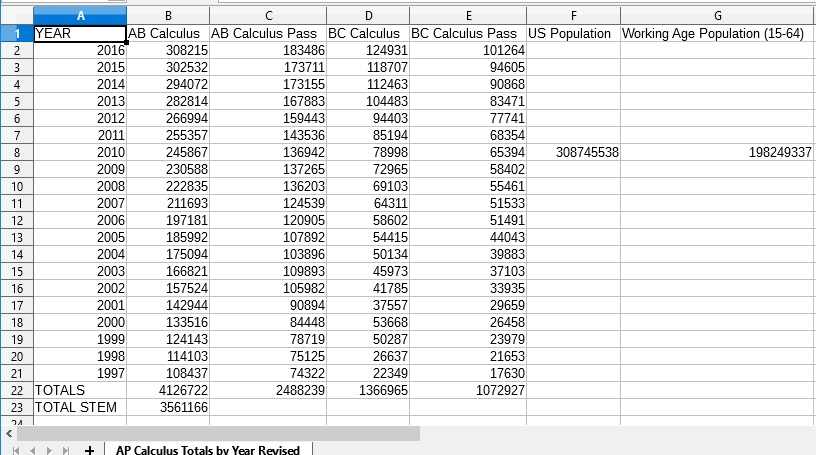
This is a followup to my previous post “A Skeptical Look at STEM Shortage Numbers”.  I was able to decipher all the archived data on Advanced Placement (AP) Calculus exams on the College Board web site back to 1997, twenty-one years ago.  My previous numbers were from 2002 to 2016 due to harder to decipher formatting of the archived data in 1997 through 2001.  This adds an additional five years to the actual data.

AP Calculus Totals by Year (1997-2016)

Repeating my analysis with the new improved numbers gives the following results (see plot above as well):

TOTAL Employed Scientists and Engineers in 2016: 6,900,000.0

ESTIMATED TOTAL PASSING AP CALCULUS SINCE 1970:  4,869,476

ACTUAL TOTAL FROM 1997 to 2016 (College Board Data):  3,561,166.0

ESTIMATED FUTURE STUDENTS (2016 to 2026): 4,337,880

ANNUAL GROWTH RATE OF STUDENTS PASSING AP CALCULUS: 5.9%

US POPULATION GROWTH RATE (2016): 0.7 %

Rapid Growth in Students Taking and Passing AP Calculus

I added an estimate of the annual percent increase in the number of US students taking and passing the AP Calculus exams to the analysis.  The analysis shows a steady rapid growth of almost six (5.9) percent per year since 1997.   This is much higher than the annual population growth rate in the United States (0.7 percent in 2016).

(C) 2018 by John F. McGowan, Ph.D.

About Me

John F. McGowan, Ph.D. solves problems using mathematics and mathematical software, including developing gesture recognition for touch devices, video compression and speech recognition technologies. He has extensive experience developing software in C, C++, MATLAB, Python, Visual Basic and many other programming languages. He has been a Visiting Scholar at HP Labs developing computer vision algorithms and software for mobile devices. He has worked as a contractor at NASA Ames Research Center involved in the research and development of image and video processing algorithms and technology. He has published articles on the origin and evolution of life, the exploration of Mars (anticipating the discovery of methane on Mars), and cheap access to space. He has a Ph.D. in physics from the University of Illinois at Urbana-Champaign and a B.S. in physics from the California Institute of Technology (Caltech).

A Skeptical Look at STEM Shortage Numbers

AP Calculus Model Revised 1997 to 2016 Data

Projected STEM Shortages

It is common to encounter claims of a shortage or projected shortage of some number of millions of STEM (Science, Technology, Engineering and Mathematics) workers — sometimes phrased as millions of new jobs that may go unfilled due to the shortage of STEM workers.  For example, the recent press release from Emerson Electric claiming a STEM worker shortage crisis includes the following paragraph:

While the survey found students today are twice as likely to study STEM fields compared to their parents, the number of roles requiring STEM expertise is growing at a rate that exceeds current workforce capacity. In manufacturing alone, the National Association of Manufacturing and Deloitte predict the U.S. will need to fill about 3.5 million jobs by 2025; yet as many as 2 million of those jobs may go unfilled, due to difficulty finding people with the skills in demand.

(Emphasis Added)

STEM shortage claimants often link the alleged shortage or projected shortage to poor K-12 education in the United States, often comparing US education critically to other nations such as Hong Kong, Singapore, and Finland.

How true are these seemingly alarming numbers?

Here are the numbers for United States students achieving a score of at least 3 out of 5, considered a passing grade — qualified, on the Advanced Placement (AP) Calculus exam, either the AB or the more advanced BC Calculus exam from the College Board.  BC Calculus is equivalent to a full first year calculus course at a top STEM university or college such as MIT or Caltech.   A score of 3 on an AP exam officially means “qualified.”

Calculus is a challenging college level quantitative course.  Being rated as qualified or better in calculus is a substantial accomplishment.  Calculus is taken by most STEM students regardless of specific STEM degree or profession. Mastering calculus demonstrates motivation, hard work, and innate ability. Calculus is required for many STEM degrees and professions. Calculus is “good to know” for nearly all STEM degrees and professions, even if not strictly required.

The AP exams are standardized tests taken by students throughout the United States, thus removing concerns about the quality of grades and certifications from differing institutions and teachers.

AP Calculus Totals by Year
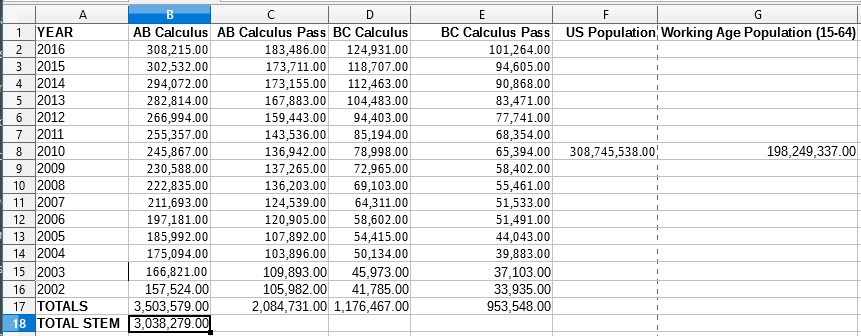
AP Calculus Totals by Year (Source: The College Board)

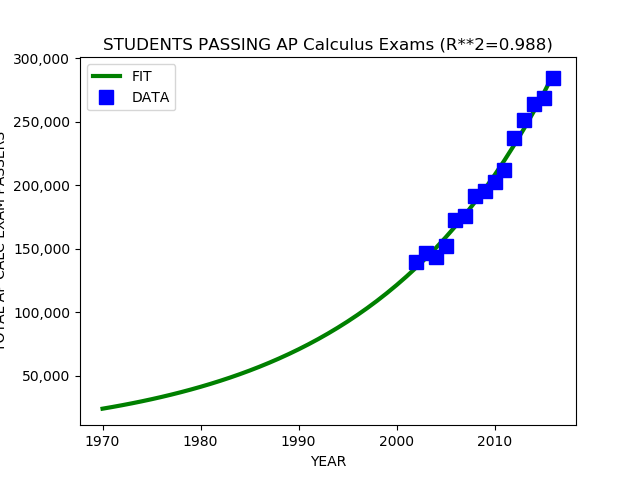
In 2016, about 284,000 students scored 3 or higher on the AP Calculus Exam, either the AB or the more advanced BC exam.  In total, just over three million students scored 3 or higher on the AP Calculus exams from 2002 through 2016.

Here are the results of fitting a simple exponential growth model to the data to estimate the number of students who have received a score of 3 or higher on the AP Calculus Exam each year since 1970:

US K-12 STEM Student Production Data and Model 1970 to 2016

This model estimates a total of just over five (5) million students scoring 3 or higher on the AP Calculus Exams since 1970 (48 years ago).  The model has a coefficient of determination of 0.988, meaning only 1.2 percent of the variation in the data is unexplained by the model.  This is excellent agreement between the model and data.

The model predicts that about 4.2 million students will take the AP Calculus Exam and score 3 or higher between 2016 and 2026 (far more than the 2 million and 3.5 million numbers quoted in the Emerson press release).  This is in addition to the over 3 million students the College Board says took the exam and scored 3 or better between 2002 and 2016 and the estimated 2 million between 1970 and 2002.

The United States produces many qualified STEM students at the K-12 level!

In 2016, the United States Bureau of Labor Statistics (BLS), arguably a more reliable and authoritative source than the Emerson press release, predicted the total number of STEM jobs would grow by 853,600 jobs from 2016 to 2026 ( a ten year prediction).  This is considerably less than the four million students expected to score 3 or higher on AP Calculus between 2016 and 2026.

The BLS estimates that there were 7.3 million science and engineering workers employed in 2016, with a projected increase to 8.2 million in 2026.

The BLS also predicted that an additional 1.439 million scientists and engineers will exit the labor force due to factors such as retirement, death, and to care for family members .  This is plausible assuming the science and engineering workforce has ages roughly uniformly distributed between 22 (typical college graduation age) and 65 (typically retirement age).  In ten years, about a quarter of the science and engineering workforce might be expected to retire, die, or leave to care for family members.  One quarter of 7.3 million is about 1.825 million.

Taken together overall growth (835,000) and retirements, deaths, etc. (about 1.8 million) give a total of about 2.635 million openings, considerably less than the predicted four million students who will take AP Calculus and score 3 or higher between 2016 and 2026.  In fact, extrapolating the 284,000 students who scored 3 or higher on the AP Calculus Exam in 2016 forward for ten years with no growth (an unrealistic assumption) still gives 2.8 million students, more than the projected number of openings.

Occupational Transfers

However, the BLS then introduces a remarkable, if not bizarre additional category of projected “openings.”  Here is John Sargent of the Congressional Research Service (CRS)’s discussion of the BLS projections:

In addition to the job openings created by growth in the number of jobs in S&E occupations, BLS projects that an additional 1. 439 million scientists and engineers will exit the labor force due to factors such as retirement, death, and to care for family members . This brings the number of S&E job openings created by job growth and those exiting the workforce to nearly 2.3 million. In addition, BLS projects that there will be an additional 3.7 million openings created by occupational transfers in S&E positions during this period, that is , workers in S&E occupations who leave their jobs to take jobs in different occupations, S&E or non-S&E.  The BLS projections do not include data that allow for a quantitative analysis of how many new workers (those not in the labor market in 2016) will be required for openings created by job growth, labor force exits, and occupational transfers , as there is no detail to how many of the S&E openings are expected to be filled by workers transferring into these openings from S&E occupations and from non-S&E occupations (that is, some workers may transfer from one S&E occupation to another, some may transfer from an S&E occupations to a non-S&E occupations, and still others may transfer from a non-S&E occupation into an S&E occupations ) . According to BLS, the projections methodology allows for multiple occupational transfers from the same position during the 10-year projection period, but only one occupational transfer in a given year.

The BLS appears to be claiming that at least 3.7 million allegedly rare and difficult to find, highly paid STEM workers,  over one half of currently employed STEM workers (7.3 million) will, for some unexplained reason — not retirement, death, or caring for a loved one — leave their profession!

This bizarre unexplained projection, now totaling six (6) million openings, finally manages to exceed the estimated four million students who will probably take AP Calculus and score 3 or better on the AP exam between 2016 and 2026.

Without the mysterious “occupational transfers,” the numbers actually suggest overproduction, a glut of STEM students at the K-12 level (more students taking the AP Calculus Exams and scoring 3 or higher than future openings).

The US Census found using the most common definition of STEM jobs, total STEM employment in 2012 was 5.3 million workers (immigrant and native), but there are 12.1 million STEM degree holders (immigrant and native).  There are many more STEM degree holders than students who took AP Calculus and scored at least 3 on the exam!  A majority of STEM degree holders do not work in STEM professions.

What should one make of this?  The BLS seems to be assuming an extremely high turnover rate in STEM workers, with at least fifty percent dropping out or being pushed out in only ten years.  This assumption may then be used to argue for a shortage!  The shortage would be due entirely to the mysterious unexplained “occupational transfers.”

Conclusion

K-12 schools in the United States produce large numbers of highly qualified STEM students who routinely take and pass the AP Calculus exam, either the AB exam or the more advanced BC exam.  Remarkably these top students alone are nearly able to fill all existing STEM jobs, not including guest workers on H1-B or other guest worker visas and not including many late bloomers who first take calculus in college or even graduate school.

NOTE: The raw data on numbers of students taking and passing the AP Calculus exams each year from 2002 to 2016 are in the Comma Separated Values (CSV) format and the Python model fitting script used in the analysis above are given in the Appendix below.  The data follows the Python script.

(C) 2018 by John F. McGowan, Ph.D.

About Me

John F. McGowan, Ph.D. solves problems using mathematics and mathematical software, including developing gesture recognition for touch devices, video compression and speech recognition technologies. He has extensive experience developing software in C, C++, MATLAB, Python, Visual Basic and many other programming languages. He has been a Visiting Scholar at HP Labs developing computer vision algorithms and software for mobile devices. He has worked as a contractor at NASA Ames Research Center involved in the research and development of image and video processing algorithms and technology. He has published articles on the origin and evolution of life, the exploration of Mars (anticipating the discovery of methane on Mars), and cheap access to space. He has a Ph.D. in physics from the University of Illinois at Urbana-Champaign and a B.S. in physics from the California Institute of Technology (Caltech).

Appendix

estimate_k12_stem.py

#
# estimate total production of STEM students at the
# K-12 level (pre-college)
#
# data and model for number of students who pass the
# AP Calculus exams (both AB and BC) from the College
# Board each year (data from 2002 to 2016)
#
# estimate total production of STEM students by K-12
# education from 1970 to 2016 (about 5 million estimated)
#
# versus about 12.1 million STEM degree holders in 2014
# and 5.3 million actual employed STEM workers in 2014
#
# Source: https://cis.org/There-STEM-Worker-Shortage
#
# (C) 2018 by John F. McGowan, Ph.D. (ceo@mathematical-software.com)
#
#
import numpy as np
import matplotlib.pyplot as plt
import matplotlib.ticker as ticker

from mpl_toolkits.mplot3d import Axes3D
import scipy.optimize as opt
import pandas as pd

df = pd.read_csv(“AP Calculus Totals by Year.csv”)

df.dropna()

ab_str = df.values[:,2]
bc_str = df.values[:,4]

ab = np.zeros(ab_str.shape)
bc = np.zeros(bc_str.shape)

index = 0
for val in ab_str.ravel():
if isinstance(val, str):
ab[index] = np.float(val.replace(‘,’,”))
index += 1

index = 0
for val in bc_str.ravel():
if isinstance(val, str):
bc[index] = np.float(val.replace(‘,’, ”))
index += 1

temp = ab + bc
total = temp[:-2]

years_str = df.values[0:15,0]
years = np.zeros(years_str.shape)
for index in range(years.size):
years[index] = np.float(years_str[index])

START_YEAR = 1970

def my_exp(x, *p):
“””
exponential model
“””
return p[0]*np.exp(p[1]*(x – START_YEAR))

p_start = [ 50000.0, 0.01 ]

popt, pcov = opt.curve_fit(my_exp, years, total, p_start)

print(popt)

STOP_YEAR = 2016
NYEARS = (STOP_YEAR – START_YEAR + 1)

years_fit = np.linspace(START_YEAR, STOP_YEAR, NYEARS)
n_fit = my_exp(years_fit, *popt)

n_pred = my_exp(years, *popt)

r2 = 1.0 – (n_pred – total).var()/total.var()
r2_str = “%4.3f” % r2

cum_total = n_fit.sum()

# to match BLS projections
future_years = np.linspace(2016, 2026, 11)

assert future_years.size == 11

future_students = my_exp(future_years, *popt)

# https://fas.org/sgp/crs/misc/R43061.pdf
#
# The U.S. Science and Engineering Workforce: Recent, Current,
# and Projected Employment, Wages, and Unemployment
#
# by John F. Sargent Jr.
# Specialist in Science and Technology Policy
# November 2, 2017
#
# Congressional Research Service 7-5700 www.crs.gov R43061
#
# “In 2016, there were 6.9 million scientists and engineers (as
# defined in this report) employed in the United States, accounting
# for 4.9 % of total U.S. employment.”
#

# BLS astonishing/bizarre projections for 2016-2026

# “The Bureau of Labor Statistics (BLS) projects that the number of S&E
# jobs will grow by 853,600 between 2016 and 2026 , a growth rate
# (1.1 % CAGR) that is somewhat faster than that of the overall
# workforce ( 0.7 %). In addition, BLS projects that 5.179 million
# scientists and engineers will be needed due to labor force exits and
# occupational transfers (referred to collectively as occupational
# separations ). BLS projects the total number of openings in S&E due to growth ,
# labor force exits, and occupational transfers between 2016 and 2026 to be
# 6.033 million, including 3.477 million in the computer occupations and
# 1.265 million in the engineering occupations.”

# NOTE: This appears to project 5.170/6.9 or 75 percent!!!! of current STEM
# labor force LEAVE THE STEM PROFESSIONS by 2026!!!!

# “{:,}”.format(value) to specify the comma separated thousands format
#
print(“TOTAL Scientists and Engineers 2016:”, 6.9e6)
print(“ESTIMATED TOTAL IN 2016 SINCE “, START_YEAR, \
“{:,}”.format(cum_total))
print(“TOTAL FROM 2002 to 2016 (College Board Data) “, \
“{:,}”.format(total.sum()))
print(“ESTIMATED FUTURE STUDENTS (2016 to 2026):”, \
“{:,}”.format(future_students.sum()))

f1 = plt.figure()
ax = plt.gca()
ax.get_yaxis().set_major_formatter(
ticker.FuncFormatter(lambda x, p: format(int(x), ‘,’)))

plt.plot(years_fit, n_fit, ‘g’, linewidth=3, label=’FIT’)
plt.plot(years, total, ‘bs’, markersize=10, label=’DATA’)
plt.legend()
plt.title(‘STUDENTS PASSING AP Calculus Exams (R**2=’ \
+ r2_str + “)”)
plt.xlabel(‘YEAR’)
plt.ylabel(‘TOTAL AP CALC EXAM PASSERS’)
plt.show()

AP Calculus Totals by Year.csv


YEAR,AB Calculus,AB Calculus Pass,BC Calculus,BC Calculus Pass,US Population,Working Age Population (15-64)
2016,"308,215.00","183,486.00","124,931.00","101,264.00",,
2015,"302,532.00","173,711.00","118,707.00","94,605.00",,
2014,"294,072.00","173,155.00","112,463.00","90,868.00",,
2013,"282,814.00","167,883.00","104,483.00","83,471.00",,
2012,"266,994.00","159,443.00","94,403.00","77,741.00",,
2011,"255,357.00","143,536.00","85,194.00","68,354.00",,
2010,"245,867.00","136,942.00","78,998.00","65,394.00","308,745,538.00","198,249,337.00"
2009,"230,588.00","137,265.00","72,965.00","58,402.00",,
2008,"222,835.00","136,203.00","69,103.00","55,461.00",,
2007,"211,693.00","124,539.00","64,311.00","51,533.00",,
2006,"197,181.00","120,905.00","58,602.00","51,491.00",,
2005,"185,992.00","107,892.00","54,415.00","44,043.00",,
2004,"175,094.00","103,896.00","50,134.00","39,883.00",,
2003,"166,821.00","109,893.00","45,973.00","37,103.00",,
2002,"157,524.00","105,982.00","41,785.00","33,935.00",,
TOTALS,"3,503,579.00","2,084,731.00","1,176,467.00","953,548.00",,
TOTAL STEM,"3,038,279.00",,,,,

Misleading Coverage of STEM Shortage Claims in US News and World Report

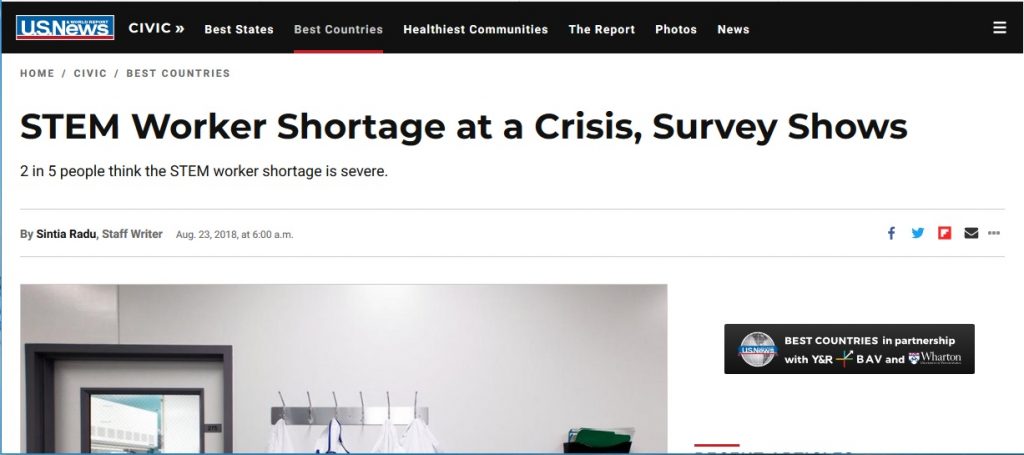
US News and World Report posted a remarkably misleading article on the alleged STEM (Science, Technology, Engineering, and Mathematics) worker shortage, featuring the headline STEM Worker Shortage at a Crisis, Survey Shows” based on a press release from Emerson, a Ferguson, Missouri based employer of STEM workers.

US News and World Report STEM Shortage Article (August 25, 2018 Screenshot)

Note: A screenshot of this article on the US News and World Report web site taken on Saturday, August 25, 2018 is shown above in case the highly misleading if not inaccurate title is subsequently changed.

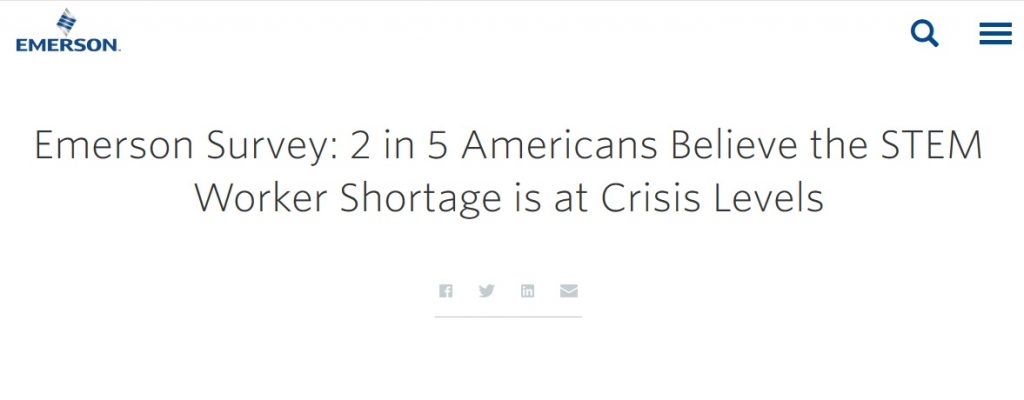
What is remarkable about this reporting is that the referenced survey of 2,000 Americans shows only that 2 out of 5 (40 %), a clear minority, believe there is a crisis.  Phrased more accurately, a sizable majority of Americans (60 %) according to the survey do not believe there is a STEM worker shortage crisis!

Emerson's Bizarre STEM Shortage Press Release Headline
Emerson’s Bizarre STEM Shortage Press Release Headline

Keep in mind this appears to be an opinion survey of what the general public believes, undoubtedly based primarily on mainstream media reporting on the purported STEM worker shortage, articles similar to this article in the US News and World Report.  Despite the heavy repetition of unsubstantiated claims that there is a severe STEM worker shortage, most Americans don’t believe it according to this survey.

People believe many things, some true, some partly true, some false.  The real question is what is true.  Surveys of belief cannot answer this.

STEM Shortage Claims

STEM shortage claims are claims that there is a desperate or severe shortage of science, technology, engineering, and mathematics workers.  This is often presented as a crisis threatening the nation — every year, year after year.  STEM shortage claims in the United States date back at least to the late 1940’s after World War II.  Despite large numbers of experienced STEM workers from gigantic war time engineering and science projects such as the Manhattan Project (the atomic bomb), the development of military radar, numerous aerospace engineering projects such as the development of the B-29 bomber and other World War II aircraft, the mass production of penicillin, and many other wartime military STEM projects, STEM employers nevertheless began to claim a desperate shortage in the nascent Cold War.  These claims accelerated after the surprise October 4, 1957 launch of Sputnik by the Soviet Union.

Cold War STEM shortage claims focused on physics, aerospace engineering, and other STEM fields associated with nuclear weapons and rocketry.  Since the end of the Cold War, STEM shortage claims have shifted to emphasize computers, electronics, electrical engineering, and especially software engineering  or “coding” in the last few years.

STEM shortage claims are made by and promoted by most major STEM employers including Microsoft, Google, Apple, Facebook, and many others.  Emerson is not unusual.  Many of these employers work together through lobbying and non-profit organizations such as FWD.us, code.org, Compete America, and others to promote these claims usually in concert with lobbying for increases in guest worker visas such as the H1-B visa and increased funding for K-12 STEM education and government promotion of STEM careers to students and their parents.

With a few notable exceptions, large heavily advertising funded media organizations such as the US News and World Report, the so-called mainstream media (MSM), reports these claims uncritically today and has reported them uncritically for several decades, at least since World War II.  This is true across the political spectrum.  The liberal New York Times and the conservative Wall Street Journal both have a long history of supporting and repeating these claims.

Frequent STEM Layoffs

Despite the perennial claims of a severe shortage and the crisis language, STEM employers frequently layoff large numbers of supposedly rare and difficult to find STEM workers.  Microsoft is a prominent but by no means unusual example of this.  Despite testimony by Bill Gates to Congress in 2008 that the United States was facing a “severe shortfall of scientists and engineers,” Microsoft has laid off at least 35,000 STEM workers since 2008.   This total does not include an unknown number of employees laid off through Microsoft’s stack and rank system until it was discontinued in 2013.

Overt layoffs and stealth layoffs such as stack and rank terminations often appear to target older, more experienced STEM workers.  Older frequently means early 30’s or even late 20’s, far beyond what “age discrimination” means to most people outside of STEM professions.  Note that the official age protected class under US federal law is 40 and above.  STEM workers who look over 35 are rare or non-existent at many STEM employers.

Despite considerable anecdotal evidence, it is difficult to prove age or (anti) experience discrimination.  Most STEM employers have refused to disclose detailed or even any data about the age, experience level, and length of tenure of their employees.  The diversity reports released each year by Google, Apple, Facebook and several other high profile STEM employers purport to break down employment only by race, ethnicity and gender.  No age data is provided.  ProPublica recently published a detailed report on alleged age discrimination in extensive layoffs at IBM.

This lack of transparency regarding the age, experience level, and length of tenure of STEM employees means that STEM students, new college graduates, and recent college graduates are unable to assess their long term career and life prospects in STEM professions.

A relatively high paying career that lasts 5-15 years, frequently ending in the mid-30’s is very different from one that lasts until normal retirement age (65) or later.

Many US STEM Students and Workers

In practice, STEM shortage claims are closely associated with claims that STEM education in the United States is poor, US students cannot handle the difficult STEM courses at a K-12 level, US students are unable and uninterested in STEM fields, and consequently US K-12 schools produce too few STEM students.

In 2016, 308,215 students took the College Board’s Advanced Placement Calculus AB exam and 124,931 students took the AP Calculus BC exam.  Of these, 183,486 students scored 3 or higher (out of 5) on the Calculus AB exam, considered passing.  A total of 101,264 students scored 3 or higher on the more advanced Calculus BC exam, comparable to a first year Calculus course at a top STEM university.  Thus, a total of  284,750 students took AP Calculus (AB and BC combined) and scored 3 or higher.  In ten years, this is 2.8 million STEM students/workers.  In 40 years, it is 11.2 million STEM workers/students.

There are currently about 5.3 million STEM workers employed in the United States and about 12.1 million STEM degree holders.

STEM Shortage Claimants Are Frequently Highly Profitable

Remarkably, despite the purported STEM shortage crisis, many prominent STEM Shortage claimants including Microsoft, Google, and Apple are highly profitable, reporting extraordinary revenues and profits per employee.  In a genuine shortage, one would expect to see STEM salaries bid up substantially, eating into and eliminating the huge profits reported by Microsoft, Google, Apple, and many other STEM employers.

Company Revenues per Employee
Apple $1,865,306
Google $1,154,896
Microsoft $732,224
Amazon $577,482
Intel $523,618
Hewlett-Packard $369,040
IBM $244,447

Source: Business Insider “Here’s how much tech giants like Apple and Google make per employee”, Oct. 6, 2015

Company Profit per Employee
Apple $393,000
Alphabet (Google) $270,000
Microsoft $147,000
Facebook $599,000

Source: Office Chai, “Here Are The Profits These 8 Tech Companies Make Per Employee“, December 26, 2017

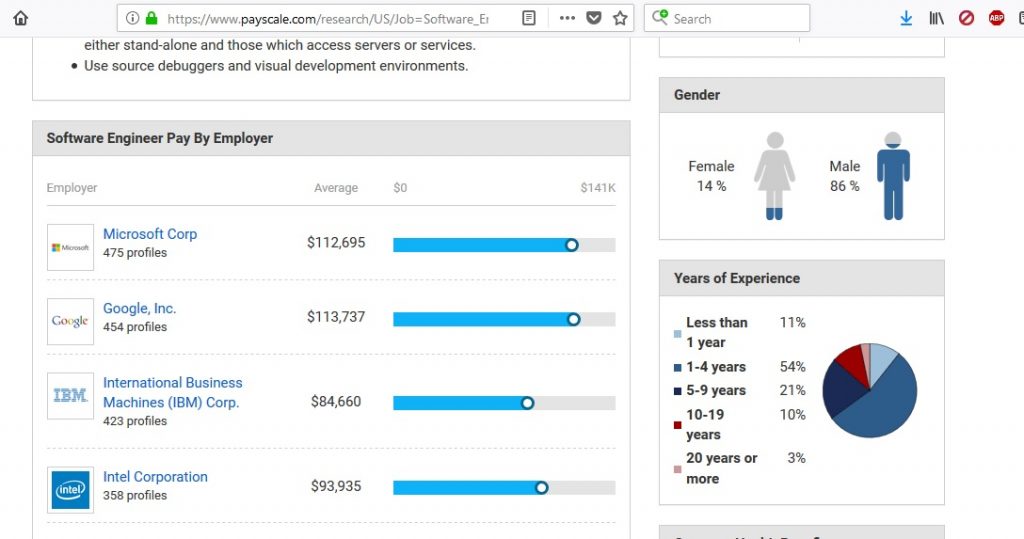
According to the employment web site PayScale, only ten percent of software engineers make over $120,000 per year.   PayScale provides average salaries for many STEM employers.  Microsoft, for example, has an average software engineer salary of only $112,695 per year.

Payscale Software Engineer Salaries

Note that the top one percent of income earners in the United States had an adjusted gross income of $465,626 or higher for the 2014 tax year according to the IRS.  The highest paid ten percent of software engineers make much less than this, usually have several years of experience (at least five and often much more), and frequently live in regions such as the Silicon Valley with extremely high housing and rental costs.

Most salary surveys like Payscale do not adjust for regional cost of living, unstable employment (frequency of periods of unemployment), and career longevity, all major issues in evaluating the salaries of software engineers and other STEM workers.  Nor do they adjust for actual hours worked (50-60 hours/week versus the more typical 40 hours per week in other professions) or chaotic or abusive working conditions.

Emerson Electric Co. (NYSE:EMR) reported total revenues of $15.26 billion in 2017 with a net income after extraordinaries (the bottom line) of $1.52 billion.   Emerson reported about 76,500 employees in 2017 to the Securities and Exchange Commission (SEC).  This is a revenue per employee of about $206,000 and a net income per employee of about $19,800.  Emerson has been solidly profitable for at least the last five years.  While not as extraordinary as Apple, there is little evidence of a STEM shortage crisis in Emerson’s financial reporting.

There is no evidence of the purported STEM worker shortage/crisis in the glowing financial statements of many prominent STEM shortage claimants.

Conclusion

The recent US News and World Report article on the alleged STEM worker shortage crisis is a particularly extreme example of the frequent uncritical repetition of STEM shortage claims from STEM employers such as Emerson by most of the mainstream media.  This slavish repetition of misleading and even false corporate press releases undoubtedly is a major contributing factor to the decline in the credibility of the major media.

(C) 2018 by John F. McGowan, Ph.D.

About Me

John F. McGowan, Ph.D. solves problems using mathematics and mathematical software, including developing gesture recognition for touch devices, video compression and speech recognition technologies. He has extensive experience developing software in C, C++, MATLAB, Python, Visual Basic and many other programming languages. He has been a Visiting Scholar at HP Labs developing computer vision algorithms and software for mobile devices. He has worked as a contractor at NASA Ames Research Center involved in the research and development of image and video processing algorithms and technology. He has published articles on the origin and evolution of life, the exploration of Mars (anticipating the discovery of methane on Mars), and cheap access to space. He has a Ph.D. in physics from the University of Illinois at Urbana-Champaign and a B.S. in physics from the California Institute of Technology (Caltech).