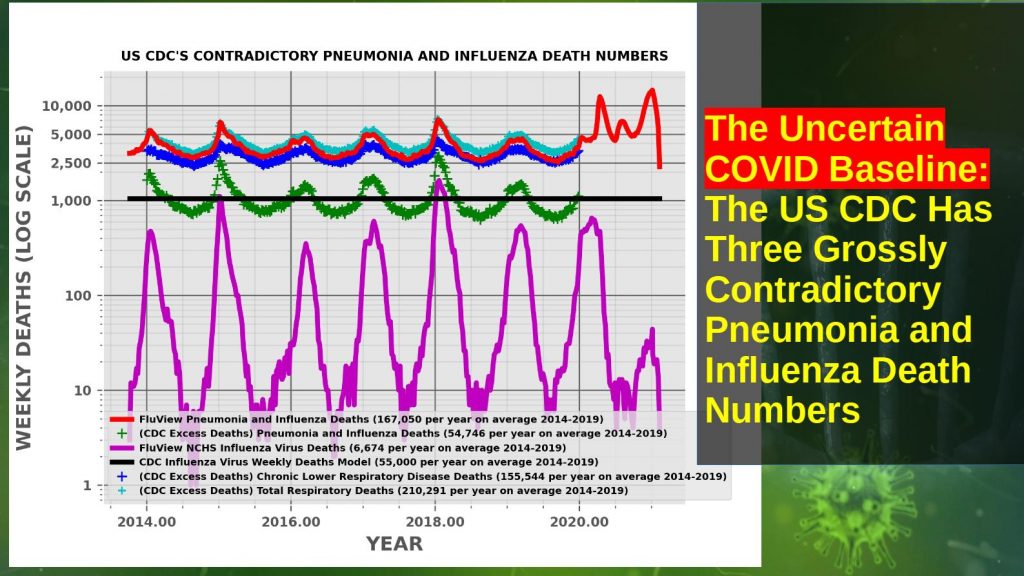
The United States Centers for Disease Control (CDC) has at least three different, grossly contradictory historical pneumonia and influenza death numbers. The CDC FluView pneumonia and influenza pre-COVID death number is OVER THREE TIMES the leading causes of death number. Pneumonia and influenza are often conflated in the CDC’s documentation and in the CDC’s influenza death model.
These death numbers are frequently used as the baseline for comparison of the COVID-19 death numbers and assessing the severity of the pandemic relative to previous years and pandemics such as the 1957, 1968, and 2009 influenza pandemics.
The Three Different Sets of Pneumonia and Influenza Death Numbers
Leading Causes of Death Pneumonia and Influenza (P&I) Deaths (About 55,000 per year)
FluView Pneumonia and Influenza (P&I) Deaths (About 167,000 pre-COVID, Over THREE TIMES Leading Causes of Death, About 7,000 Influenza Virus Deaths Per Year)
CDC Model Influenza Virus Deaths (About 55,000 per year, at least THREE TIMES FluView Influenza Deaths)
This is the program and data files used to generate the plot above comparing the CDC’s pneumonia and influenza death numbers from 2014 through 2019. Download and use the 7-Zip or other file archiver for MS Windows or the Unix command tar -xvf cdc_numbers.tar to unpack the program and data files.
This Python 3 program generates a plot comparing the different numbers on a log scale for easy comparison.
The program also plots the weekly deaths for “chronic lower respiratory disease,” mostly chronic bronchitis and emphysema — also referred to as “chronic obstructive pulmonary disease” in the medical literature. It is likely that the THREE TIMES LARGER FluView pneumonia and influenza death numbers are produced by borrowing deaths from chronic lower respiratory disease (mostly chronic bronchitis and emphysema) and adding them to the “pneumonia and influenza” deaths reported in the leading causes of death report.
The article “Are COVID Death Numbers Comparing Apples and Oranges?” at
http://wordpress.jmcgowan.com/wp/are-covid-death-numbers-comparing-apples-and-oranges/
discusses these issues in much more detail and provides references and links.
(C) 2021 by John F. McGowan, Ph.D.
About Me
John F. McGowan, Ph.D. solves problems using mathematics and mathematical software, including developing gesture recognition for touch devices, video compression and speech recognition technologies. He has extensive experience developing software in C, C++, MATLAB, Python, Visual Basic and many other programming languages. He has been a Visiting Scholar at HP Labs developing computer vision algorithms and software for mobile devices. He has worked as a contractor at NASA Ames Research Center involved in the research and development of image and video processing algorithms and technology. He has published articles on the origin and evolution of life, the exploration of Mars (anticipating the discovery of methane on Mars), and cheap access to space. He has a Ph.D. in physics from the University of Illinois at Urbana-Champaign and a B.S. in physics from the California Institute of Technology (Caltech).

